PLANNING Screen
On the PLANNING screen, you can perform the following actions:
Review the task schedule by asset tree (see Check Schedule by Asset Tree)
Manage tasks (see Tasks)
Manage planning templates and planning tasks (see Planning Templates)
Assign and review risk models (see Risk)
Schedule shutdowns (see Shutdowns)
Edit task instructions (see Task Instructions)
Check Schedule by Asset Tree
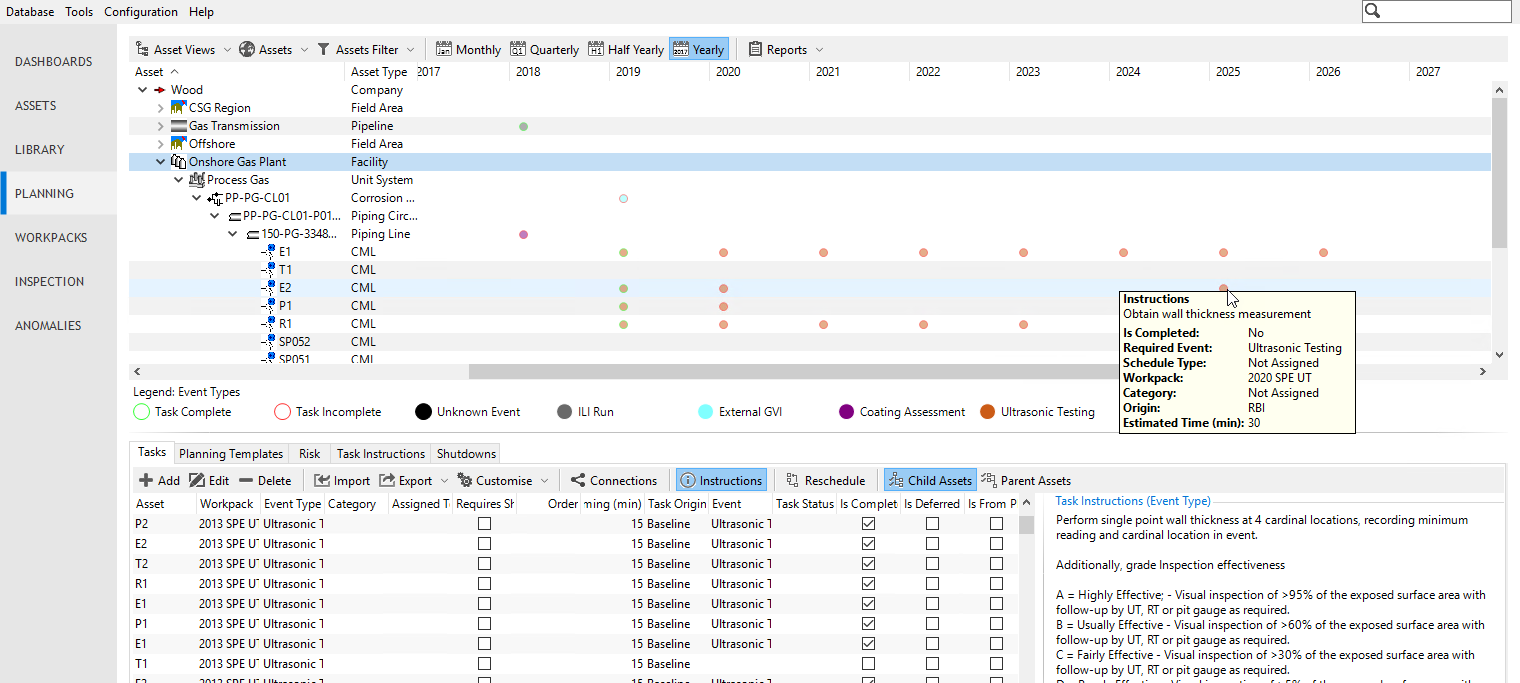
The upper section of the PLANNING screen displays tasks in a calendar view, organised by asset. Each task appears as a dot with two colours:
Outer ring: Indicates task completion (green = complete, red = incomplete)
Inner dot: Represents the event type (colour is configurable, see Configure Event Types).
The date shown for each task in the calendar corresponds to the actual start date of the associated workpack.
Hovering over a task dot reveals a tooltip with details such as the task description, workpack, event type, completion status, and any linked anomaly actions.
On this screen area, you have the following options:
: Toggle the outer ring display to show task completion status.
Calendar Granularity: Choose between Monthly, Quarterly, Half Yearly, or Yearly views to adjust the calendar granularity. For example, if you select Monthly, there will be one column for each calendar month.
Asset Views and Assets toolbar options: Use these options as on the ASSETS screen, see Asset Views and Assets Toolbar. Note that on the PLANNING screen, not all options may be available.
Planning Toolbar
Toolbar Option
Description
See Asset Views.
See Assets Toolbar.
Activates or deactivates the display of task completion in the outer ring of the dot. When selected, each task in the calendar will be outlined with a green (complete) or red (incomplete) circle identifying the completion status of that task.
Allows you to choose the ‘resolution’ of the grid. For example, if you select Monthly, there will be one column for each calendar month.
See Reports.