Dashboards
Dashboards display the output from any report template that has been configured in the report template library and marked as a Dashboard. For example, you can choose report templates that summarise data in the database, or that show statistics on anomalies or risk.
You can view dashboards on the DASHBOARDS screen or on the Dashboards tab on the ASSETS screen (see Asset Dashboards).
When you log in NEXUS IC for the first time, you will be presented with the DASHBOARDS screen. On subsequent logins, NEXUS IC will open to the screen that was active when you logged out.
Note
If you make changes to data, the dashboard will not be refreshed to show those changes automatically. You’ll need to click the Refresh button.
Prerequisites
To make report templates available as dashboards, the following configurations must have been done:
A report template must exist under . For more information, see Configure Report Templates.
The report template must have been set as a dashboard in your configuration settings under . For more information, see Set a Report Template as a Dashboard.
Using the Dashboard
To select a dashboard template:
Click the Dashboard toolbar button on the DASHBOARDS screen.
From the drop-down list, choose the required template.
Templates are grouped by the report categories as per your configuration settings (Configure Reports and Dashboards).
Note
If the report template linked to the dashboard includes user-configurable parameters, the Parameters toolbar button will be active. You can click this button to adjust the selection parameters as needed. The selected values are automatically saved in your user profile settings under the Report category (see Your Profile).
Dashboard Actions
On the dashboard, you can perform various actions depending on the specific report element:
Charts
For charts (including risk charts), you can click on a data point to get a list of rows that make up that point, or a form showing the single row represented by that cell.
You can click a legend item to show or hide data related to that legend item in the chart. If you hover over a legend item, the chart shows only the related data.
Hovering over a chart element will show a tooltip with relevant information. This functionality is similar to that of charts on the Charts tab. Note that hover tooltips are not visible on the Risk Matrix or Tables report elements.
Tables
Tables have a blue
ellipsis at the top right. You can view or edit the contents of a table row by double-clicking the row or selecting the row, clicking the blue ellipsis, and choosing Edit.
Pivot Tables
Pivot tables have a little blue
ellipsis on each cell that contains a number. Clicking that ellipsis will show either a grid with a list of all the rows that make up the number in that cell, or a form showing the single row represented by that cell. If you have edit permission on the relevant table, you can make changes here and click OK to save them.
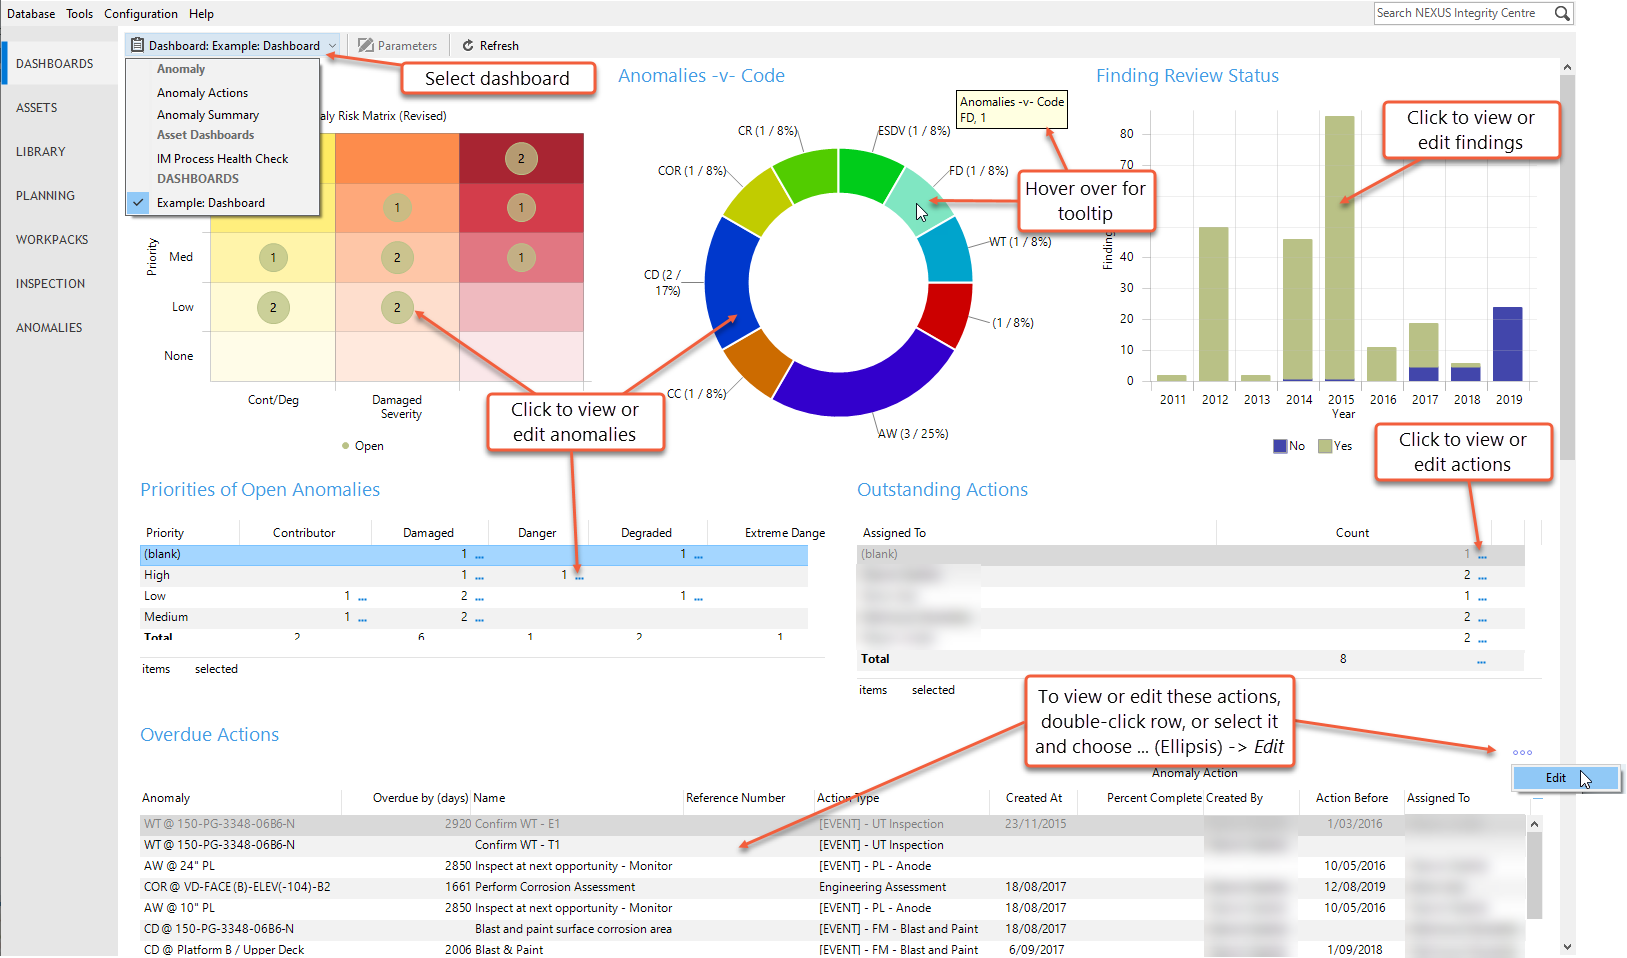
Example Dashboard
The image below shows an example dashboard and highlights the actions available for this specific template: