Add Pivot Table for Tasks with Text, Extended Simple Source with Filter
In the first part of the report, we want to insert a pivot table that shows the number of tasks by asset type and event type in a workpack selected by the user during report generation. We want to add a heading and a description before the table. To do that, we create the following elements:
An Element Group to include the pivot table, text and heading
A level-2 Section Heading
A Text (Paragraph) element to include a description
A Simple Source for the Task system table, which we extend with the Asset Type field and add a filter for Workpack ID as a user parameter.
The actual Pivot Table
See the detailed steps below:
Prerequisites
You have completed the following steps:
Process
1. Insert an Element Group.
This element will contain the heading, text, pivot table and simple source that we are going to create for this section of the report.
Add an Element Group element to the Report Layout structure.
Double-click the element in the structure to edit it.
Enter the name Tasks, which will identify the element in the structure. You do not need to make other settings for the element group right now.
Click OK.
2. Insert a level-2 Section Heading for the pivot table.
Add a Section Heading element to the Report Layout structure so that it is included within the Tasks element group.
Double-click the element in the structure to edit it.
Enter a name that identifies the element in the structure, for example, Task List Heading 2. This text does not appear in the actual report output.
Enter the text of the heading that you want to see in the output in the Content field, for example, Number of Tasks by Asset Type and Event Type.
Select the Include in Table of Contents checkbox to have this section heading appear in the Table of Contents.
In the Default Style field, select Heading 2, which is a preconfigured style that can be applied for level-2 section headings. If required, you can set up your own style and apply that instead (see Styles).
Click OK.
3. Insert a Simple Source for the Pivot Table.
This simple source will be used as the data source for the pivot table that calculates the number of tasks by asset type and event type in a user-specified workpack. Since the Task system table that we are going to assign doesn’t contain the Asset Type field, we will extend the simple source with that and we also set up a filter with a user parameter for Workpack ID. When generating the report, the user can then select the required workpack in a selection dialog.
Add a Simple Source element to the Report Layout structure so that it is included within the Tasks element group. The Simple Source element is located under the SOURCES node within the Template Definition section of the dialog.
Note
You must insert the simple source within the element group, else, you cannot refer to it from the other elements of the element group.
Double-click the Simple Source element in the structure to edit it.
Specify the name Task Listing* for the simple source.
In the Table field, click the ellipsis
to select the System Table Task.
On the Fields tab, add an extra field as follows:
Click Add to add an extra field to the Simple Source.
You can see that a Simple Column entry has been added but with no field selected.
Right-click the row, or choose Input from the toolbar and choose Field…, which brings up a new dialog.
Select the Asset Type field under the Asset Location system table.
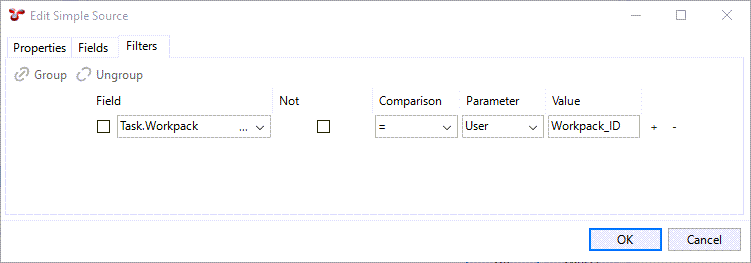
On the Filters tab, create a new filter with the following data:
Field: Workpack (available from the drop-down list since it’s a field within the source)
Comparison: =
Parameter: User
Value: Workpack_ID
Click OK.
4. Insert a Text (Paragraph) element for introduction.
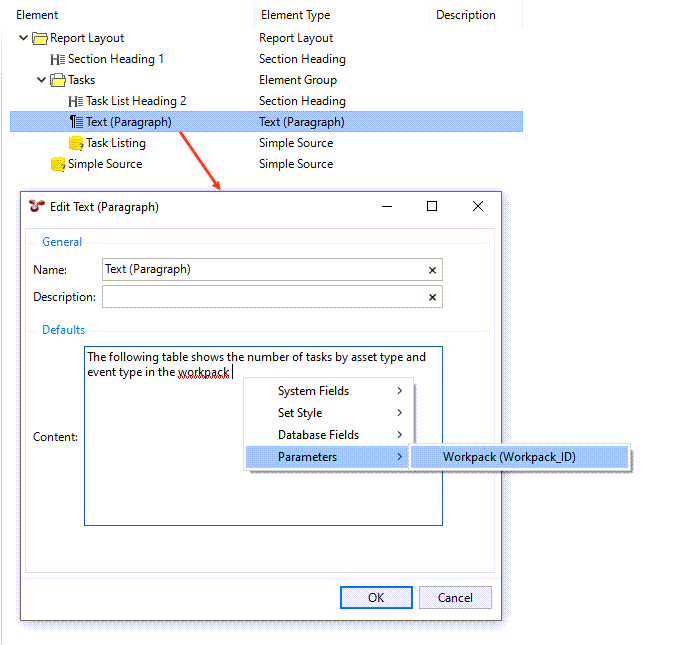
You want to insert an introductory text to the report before the pivot table. You want this text to include the workpack ID that the user selects when generating the report, thus, it has to be a variable. To do that, you add a Text (Paragraph) element as shown below:
Add a Text (Paragraph) element to the Report Layout structure so that it is included within the Tasks element group and it comes after the Section Heading element.
Double-click the new element in the structure to edit it.
In the Content field, enter text as follows:
Enter The following table shows the number of tasks by asset type and event type in the workpack .
Right-click and choose to select the user parameter that you have added to the Simple Source earlier.
Click OK.
5. Insert a Pivot Table for Tasks.
We want the pivot table to show the number of tasks by asset type and event type in the workpack that the user selected.
Add a Pivot Table element to the Report Layout structure so that it is included within the Tasks element group.
Double-click the element in the structure to edit it.
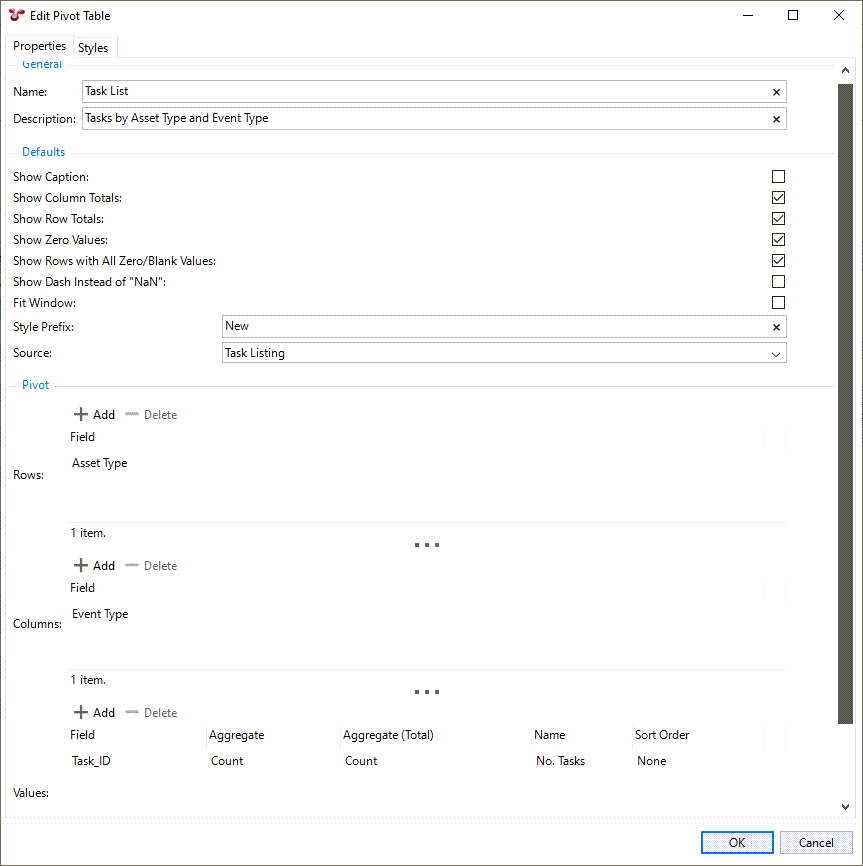
In the top part of the Edit Pivot Table dialog, enter data as follows:
Name: Enter Task List or any name that identifies the element in the structure.
Description: Tasks by Asset Type and Event Type
Show Caption: Tick to add the name of the pivot table as a caption.
Show Column Totals: Tick to add a row that shows the total number for each column.
Show Row Totals: Tick to add a column that shows the total number for each row.
Show Zero Values: Tick to show values even if it is 0. If you disable this option, any values that would have shown “0” will be replaced with a blank.
Show Rows with All Zero/Blank Values: Tick so that if a row contains “0” value or no value at all, it will be shown in the output.
Style Prefix: Enter New to use the style that you have set up in the example for Anomaly Summary Report, see 4. Create a new style for even rows..
Source: Select Task Listing.
Under the Pivot section of the dialog, make settings as follows:
In the Rows section, choose Add.
Double-click in the new row that has been added and select Asset Type. The available fields in the drop-down list are retrieved from the Source that you have selected above. This setting determines that the rows of the pivot table will correspond to the values of the Asset Type field.
In the Column section, choose Add.
Double-click in the new row that has been added and select Event Type. This determines that the columns of the pivot table will correspond to the values of the Event Type field.
In the Values section, we set up what we want to be calculated and based on which field. In our case, we want to count the number of tasks, so the field based on which we want to perform the calculation will be Task_ID, which is unique to each task record. Thus, make settings for the corresponding columns as follows:
Field: Select Task_ID.
Aggregate: Select Count.
Aggregate (Total): Select Count.
Name: Enter No. Tasks. If you calculate row totals, this will be shown as the title of the column heading.
Click OK.
Result
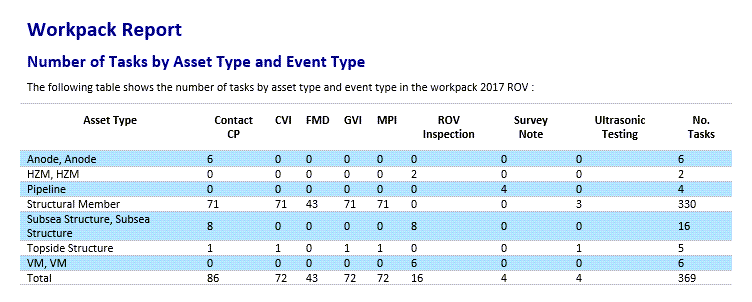
When you generate the output, you can see that the pivot table has been inserted with the new style and shows the calculated number of tasks for each asset type and event type combination. The text above the pivot table shows the workpack ID that you selected when generating the report.
