Summary Screen
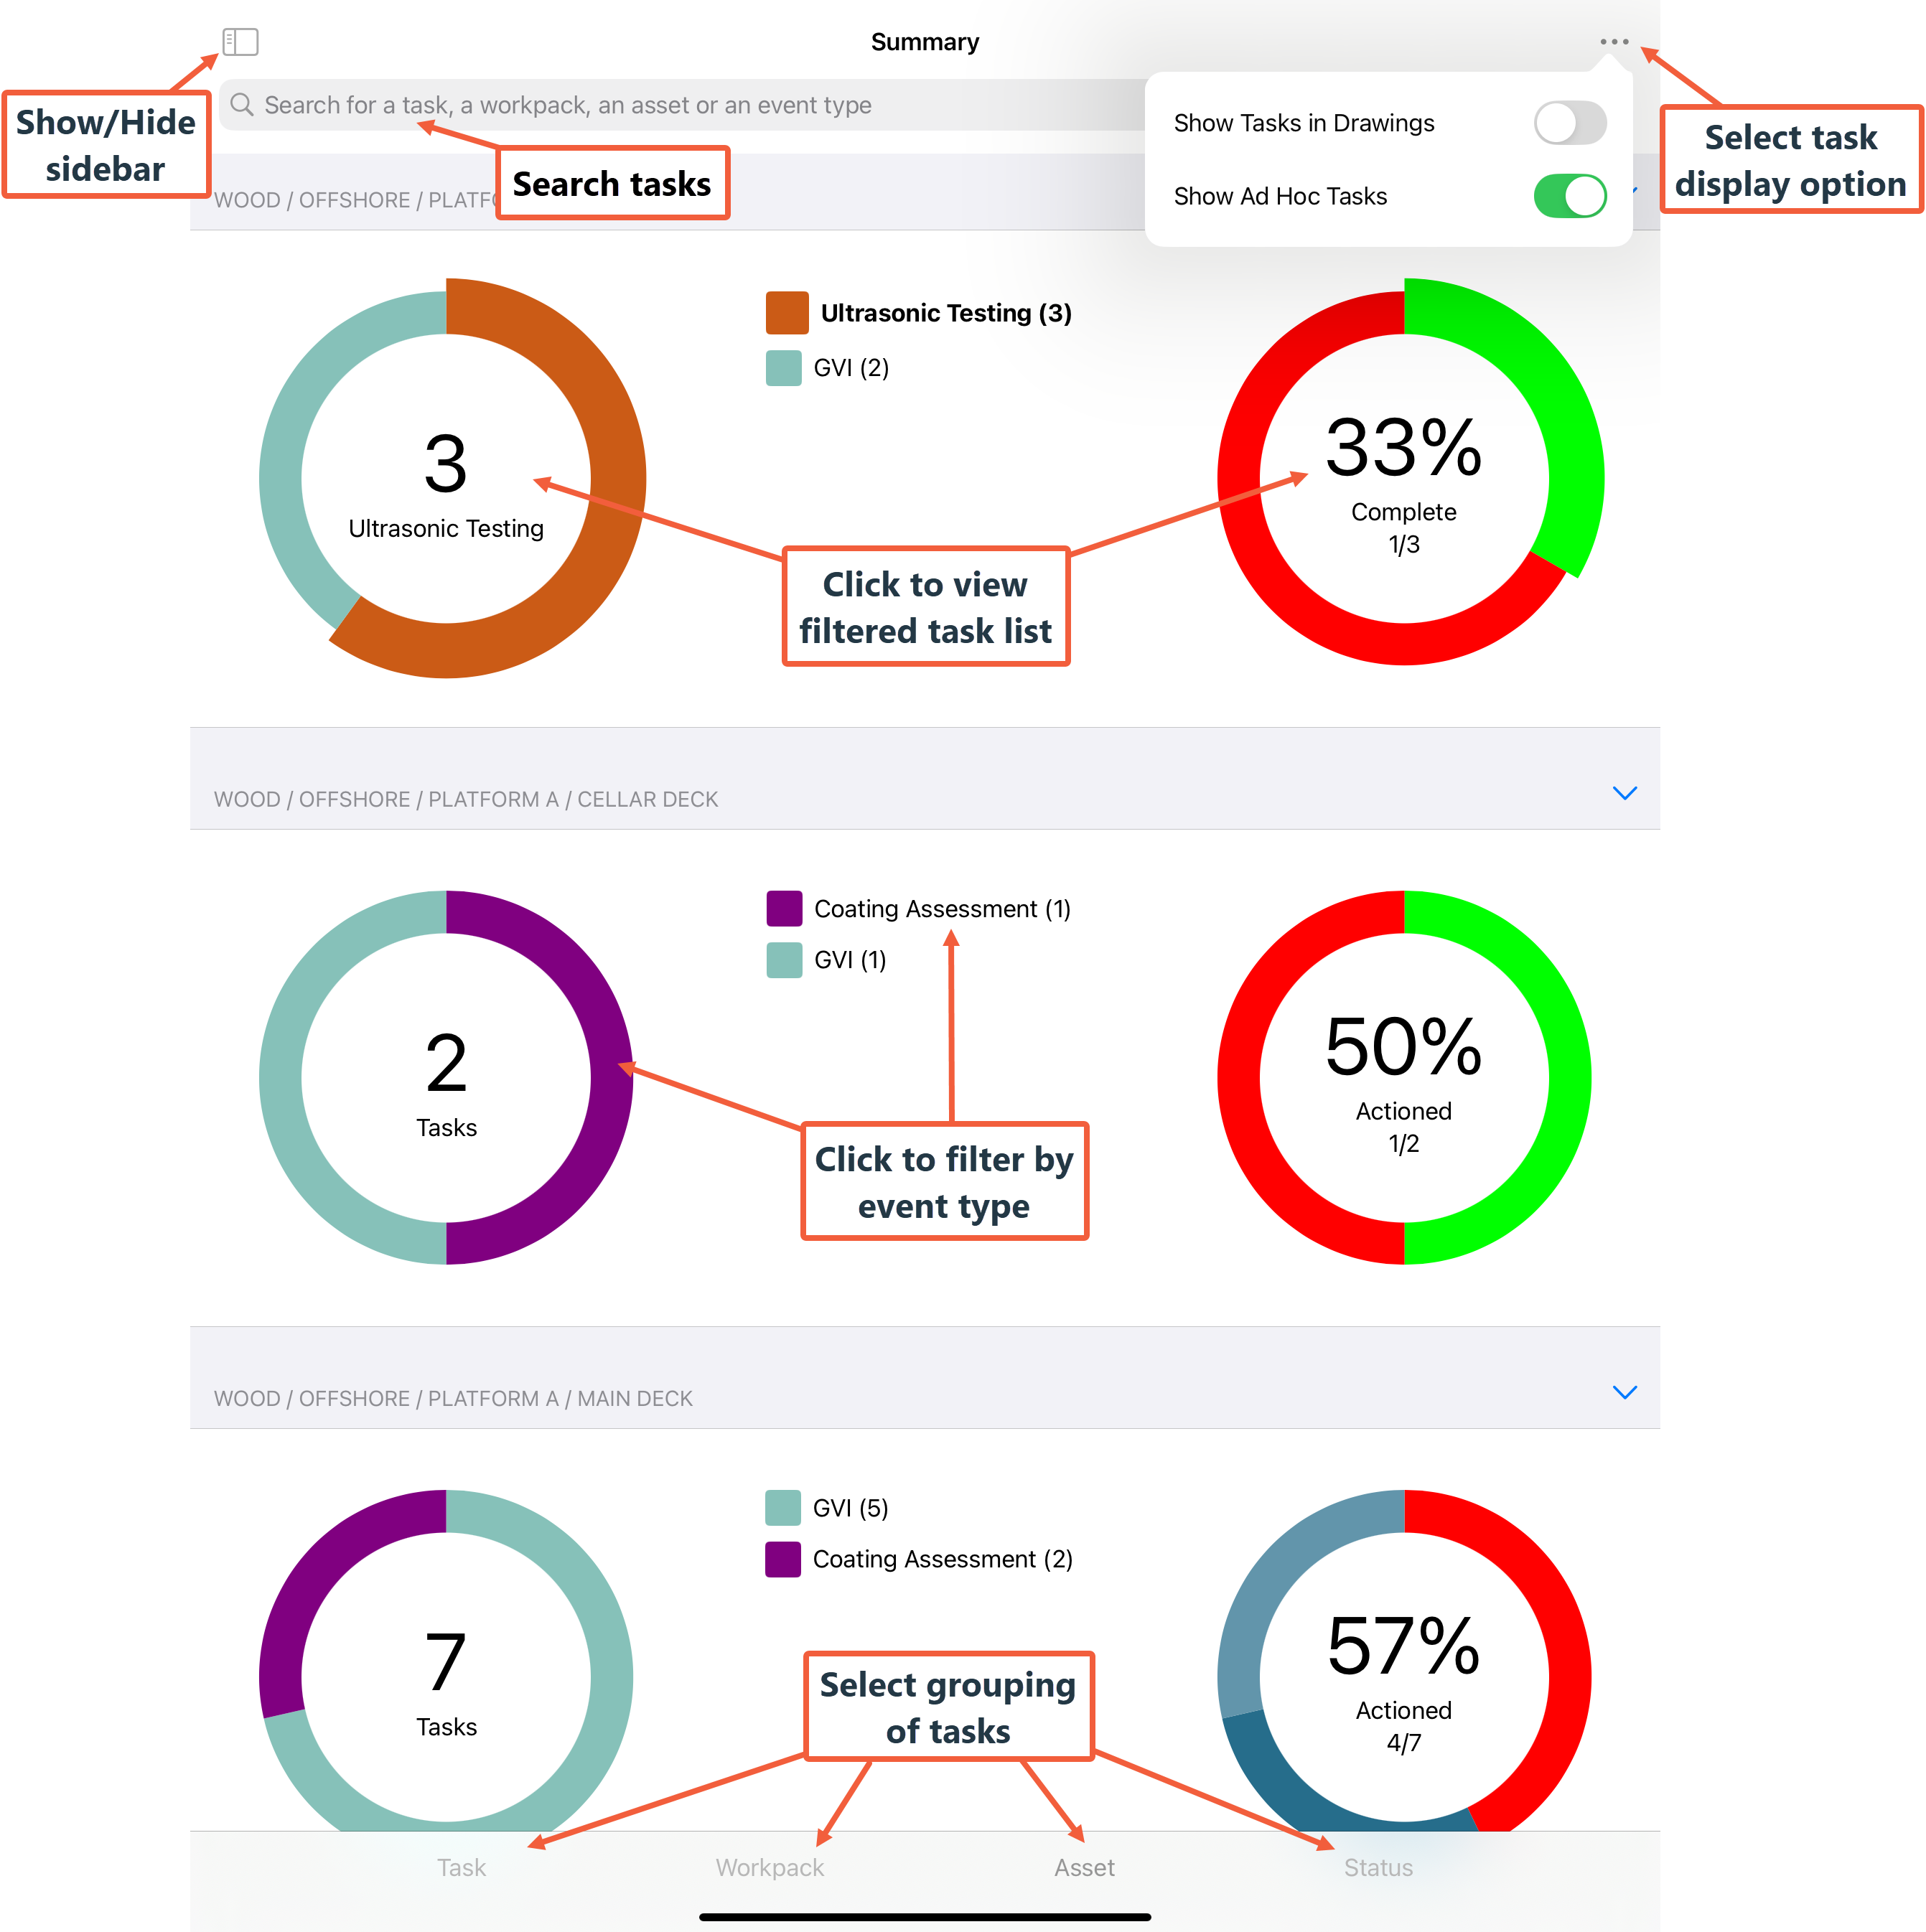
The Summary screen provides a visual overview of your assigned tasks and their completion status using doughnut charts. Its layout is similar to the dashboard in NEXUS IC.
Available Views
From this screen, you can access four distinct views from the bottom menu. Each view groups tasks by a higher-order category:
Task |
Displays doughnut chart pairs grouped by assigned tasks and ad hoc tasks. |
Workpack |
Displays doughnut chart pairs for each workpack containing your assigned tasks. |
Asset |
Displays doughnut chart pairs for each different asset you have assigned tasks on. |
Status |
Displays doughnut chart pairs for each task status. |
In each view:
The left chart shows the number of tasks by event type.
The right chart shows the percentage of tasks completed.
Using the Summary Screen
From the Summary screen, you can perform the following actions:
Action |
Result |
|---|---|
Enter a search term in the search bar at the top of the screen and hit Enter |
Allows you to search for tasks. On the Summary screen, the search function indexes the Task Name, Asset Name or Location, the Event Type Name, and Workpack Name or abbreviation depending on the Workpack Display Name setting. |
Tap the |
Toggles between showing or hiding the sidebar on the screen. |
Tap the |
Opens options to toggle Show Tasks in Drawings and Show Ad Hoc Tasks on or off. This can be used when you check a collection of tasks. When you toggle Show Tasks in Drawings off, you will be shown a list of Tasks Screen, and if toggled on, you will see a collection of Drawings Screen with tasks in layers on those drawings. |
Tap the text at the centre of a doughnut |
Opens a page that shows only the relevant collection of tasks. The way tasks are shown on this page is determined by what you have selected under |
Tap a segment of a doughnut or its name in the chart legend |
Filters tasks by the selected event type and shows:
Example: Tapping the segment Coating Assessment on the left-hand chart highlights that segment and displays the number of Coating Assessment tasks versus the total tasks. The right-hand chart then shows the proportion of Coating Assessment tasks completed. |
Tap the top centre of the screen |
Quickly scrolls back to the top of the list. |