Add Page Break, Charts of Templates
In this step, you create a Charts of Templates that show data regarding your anomalies. You want to display the two charts next to each other, in two columns. For that, you create the following:
An Element Group to include all the Chart Templates
A level-2 Section Heading to be included in the output before the charts
A Simple Source for the Anomaly system table, from which the Chart Templages can retrieve data
The actual chart templates
See the detailed steps below:
Prerequisites
You have completed the following steps:
Process
1. Insert an Element Group for the charts.
This element will contain the charts that we’re going to create.
Add an Element Group element to the Report Layout structure. It should be on the same level as the element group you created for the table of data.
Tip
If the element is not inserted to the right location in the element structure, use the Move Up or Move Down buttons in the toolbar to move them to the correct place.
Double-click the element in the structure to edit it.
Enter the name Charts, which will identify the element in the structure. You do not need to make other settings for the element group right now.
Click OK.
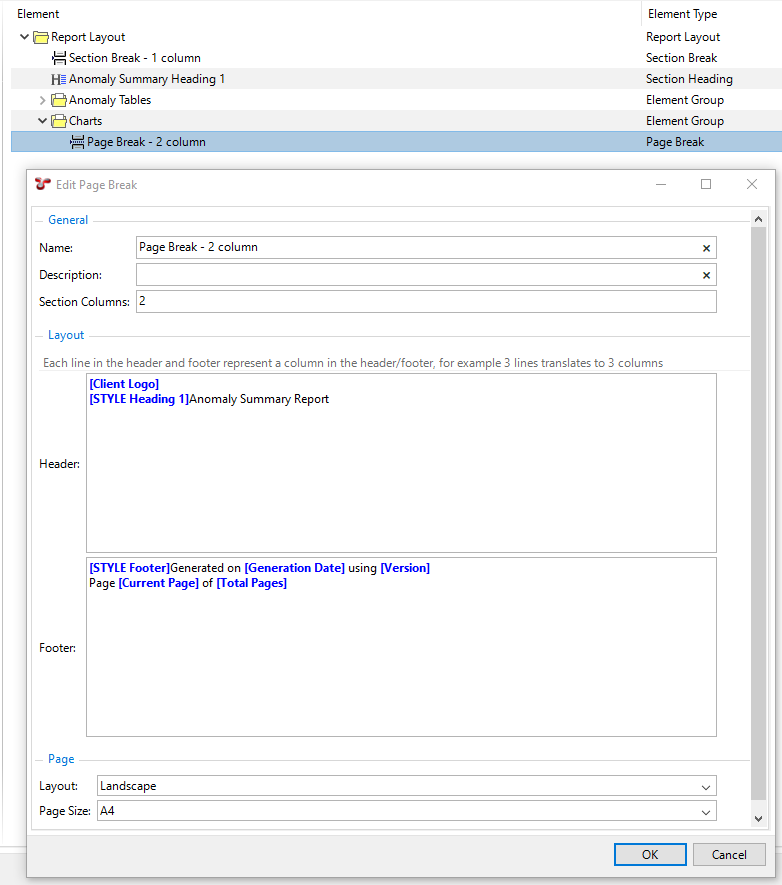
2. Add a Page Break element to place the charts on a new page and set up its layout.
You want the charts to appear on a new page and next to each other in two columns. To do that, proceed as follows:
Add a Page Break element to the Report Layout structure so that it is included within the Charts element group.
Double-click the element in the structure to edit it.
Enter a name that identifies the element in the structure, for example, Page Break - 2 column.
In the Section Columns field, enter 2.
In the Header and Footer fields, enter the same values that you used for the Section Break above, so that they are the same on the new page.
Under Page, select the Landscape for the Layout and A4 for Page Size.
Click OK.
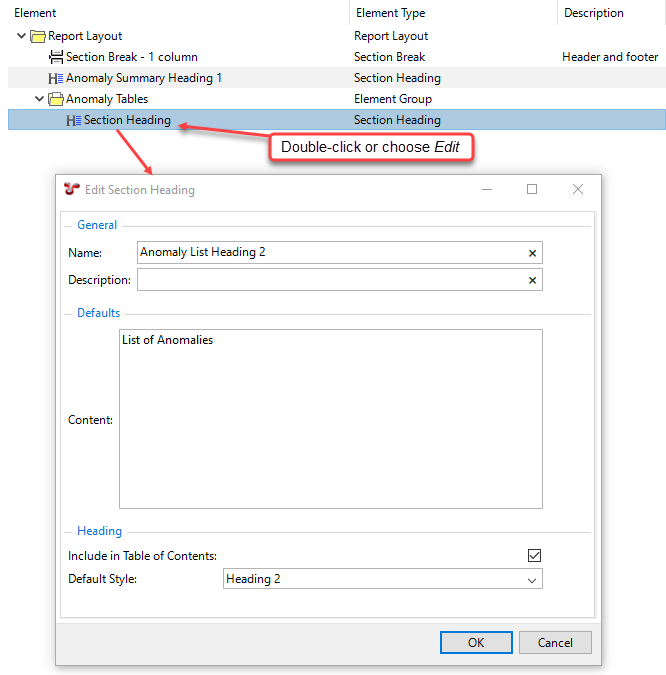
3. Insert a level-2 Section Heading for the charts.
Add a Section Heading element to the Report Layout structure so that it is included within the Charts element group.
Double-click the element in the structure to edit it.
Enter a name that identifies the element in the structure, for example, Charts Heading 2. This text does not appear in the actual report output.
Enter the text of the heading that you want to see in the output in the Content field. This time, we just want to use the heading Anomaly Charts, but you can use right-click in this field if you want to add a variable.
Select the Include in Table of Contents checkbox to have this section heading appear in the Table of Contents.
In the Default Style field, select Heading 2, which is a preconfigured style that can be applied for level-2 section headings. If required, you can set up your own style and apply that instead (see Styles).
Click OK.
4. Insert a Simple Source for Anomalies.
This simple source will be used as the data source for the chart templates that we are going to create. To do this, follow the same steps as described in 3. Insert a Simple Source for Anomalies., but insert the simple source within the Charts element group.
Add a Simple Source element to the Report Layout structure so that it is included within the Charts element group. The Simple Source element is located under the SOURCES node within the Template Definition section of the dialog.
Note
You must insert the simple source within the element group, else, you cannot refer to it from the other elements of the element group.
Double-click the Simple Source element in the structure to edit it.
Specify the name Anomaly* for the simple source.
In the Table field, click the ellipsis
to select the System Table Anomaly.
Click OK.
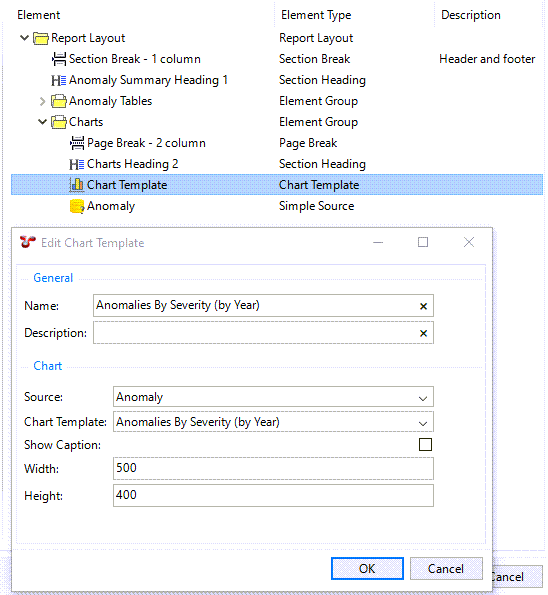
5. Insert a Chart Template for Anomalies By Severity (by Year)
Add a Chart Template element to the Report Layout structure so that it is included within the Charts element group.
Double-click the element in the structure to edit it.
Enter data as follows:
Name: Enter Anomalies By Severity (by Year) or any name that identifies the element in the structure.
Source: Select Anomaly source
Chart Template: Select Anomalies By Severity (by Year). The available chart templates in the drop-down list are determined by the system by checking which chart templates refer to the table that you selected as a source above. You can only select from those chart templates that have a reference to the source that you selected (for example, they use data from that table for one of their axes).
Width: 500
Height: 400
6. Insert a Chart Template for Anomalies -v- Code
Follow the same process as in the previous step to insert another chart template but with the following data:
Name: Enter Anomalies -v- Code or any name that identifies the element in the structure.
Source: Select Anomaly source
Chart Template: Select Anomalies -v- Code.
Width: 500
Height: 400
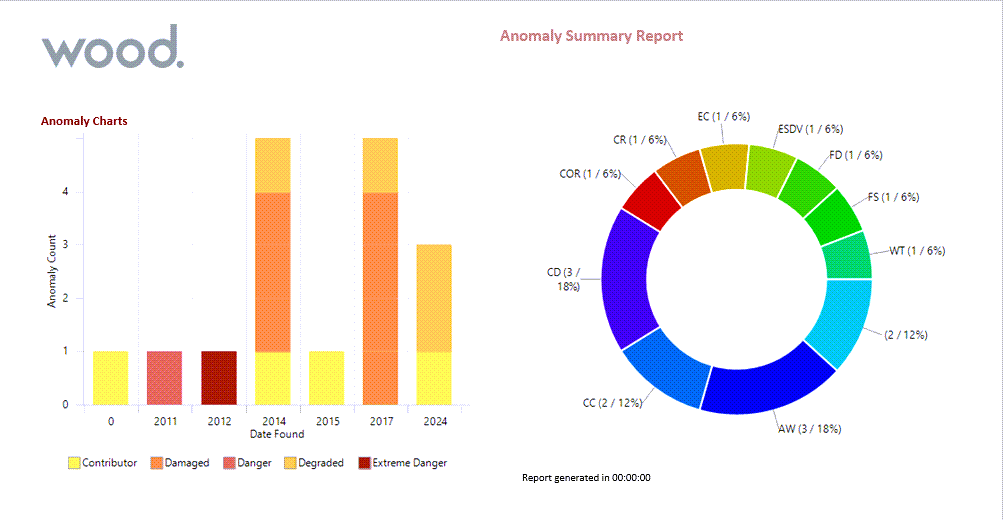
Result
When you generate the output, you can see that the chart templates are inserted next to each other in two columns: