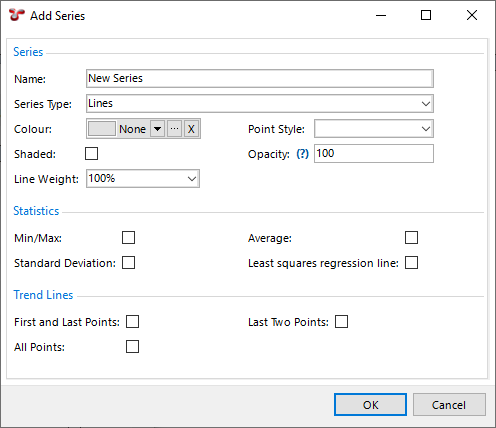
Add/Edit Series Dialog
See below for the description of fields in the Add Series/Edit Series dialogs. Fields that are self-explanatory are not explained.
Series tab:
The availability of fields on this tab depends on the type of the chart that you choose in the Series Type field.
Field/Checkbox Name
Description
Name
Enter a name that uniquely identifies the series within the chart template. If your chart has just one series (this is common), you’ll often give the series the same name as the chart.
Series Type
Specifies the type of the chart that you want to use for the series data display.
Shaded
If you tick this checkbox, the area between your line series and the horizontal axis will be shaded in a paler version of the series’ colour. This checkbox is available only for the Lines, Horizontal Lines, Bezier Lines and Polygon series types.
Checkboxes under Statistics and Trend Line screen areas
If you tick the checkboxes under these screen areas, you will see the corresponding lines displayed on your chart. Standard Deviation shows horizontal lines one deviation above and one deviation below the mean. These screen areas are available only for the Lines, Horizontal Lines, Bezier Lines, Bubble and Points series types.
Axis tab:
On this tab, you can configure one or more axes for a series. For more information, see Configure Axes for a Chart Template Series.
See also
