Set Up Anomaly Risk Matrix
To enable displaying the risk assessment results for anomalies on the ANOMALIES screen, you must set up the functionality as described below.
Set up the risk chart, which determines the axes and the number of squares on the risk matrix as well as the risk colours and risk values that belong to each square. For more information, see Configure Risk Charts.
For example, in the risk chart below, you want to have Severity on the X axis with a granulation of 3, and on the Y axis, you want to have Priority on the Y axis with a granulation of 5.
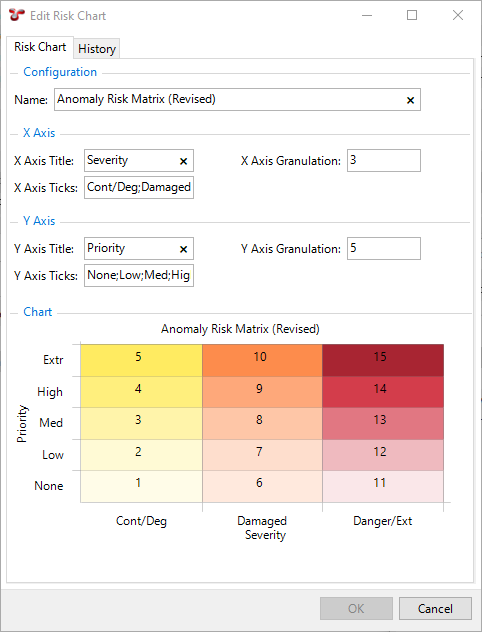
Severity and Priority are parameters of the anomaly (defined in Add/Edit Anomaly Dialog), but you can use other parameters as required.
Note
Anomalies do not have a Likelihood or Consequence to give them an X/Y position on the diagram. Instead, their placement is solely determined by the risk score, which is calculated using a specific function called System - Anomaly - Risk Score (see next step). The numerical value of the risk score corresponds to the square in the risk matrix where the anomaly will be positioned. The matrix must be defined to only have unique values in each square.
Under , configure the System - Anomaly - Risk Score function, which calculates the actual risk score of each anomaly. For more information, see Configure Functions. The result of this function is a number that will be used to position the anomaly in the corresponding square inside the risk matrix.
The System - Anomaly - Risk Score function is predelivered with the basic asset or anomaly parameters included. You cannot add new parameters to this function, however, you must set up the connections for the parameters that you want to use.
Using the example from the previous step, if you want to use the Severity and Priority parameters of the anomaly, you can configure the function as follows:
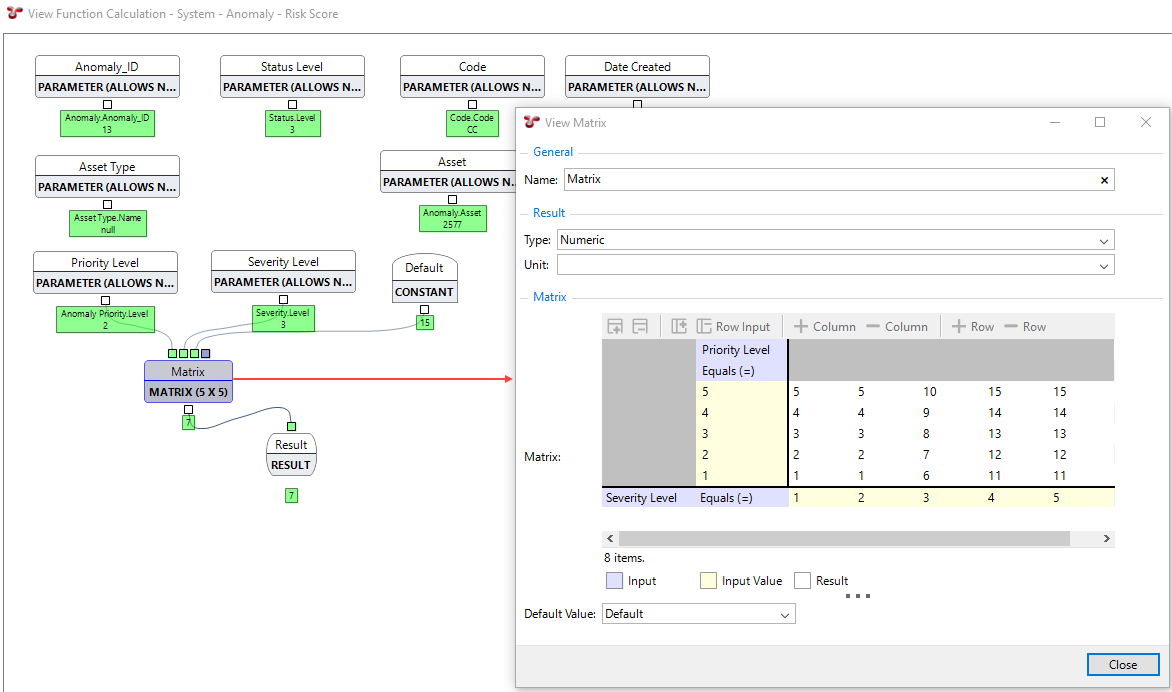
In this example, you draw a connection from the Priority Level and Severity Level parameters as well as a default constant value to a matrix element. In the matrix element, you set up the specific risk score values to be applied for each combination of the Priority Level and Severity Level parameter values. You can also set up a default value to be applied in case these input values are not accessible. From the matrix element, you draw a connection to the result element to complete the configuration of the function.
In your database properties, specify the anomaly risk chart to be used when you open the ANOMALIES screen.
To do that, under , go to the Settings tab and select the risk chart defined above in the Anomaly Risk Chart field. For more information, see Properties Dialog.