Configure Pipeline View Chart
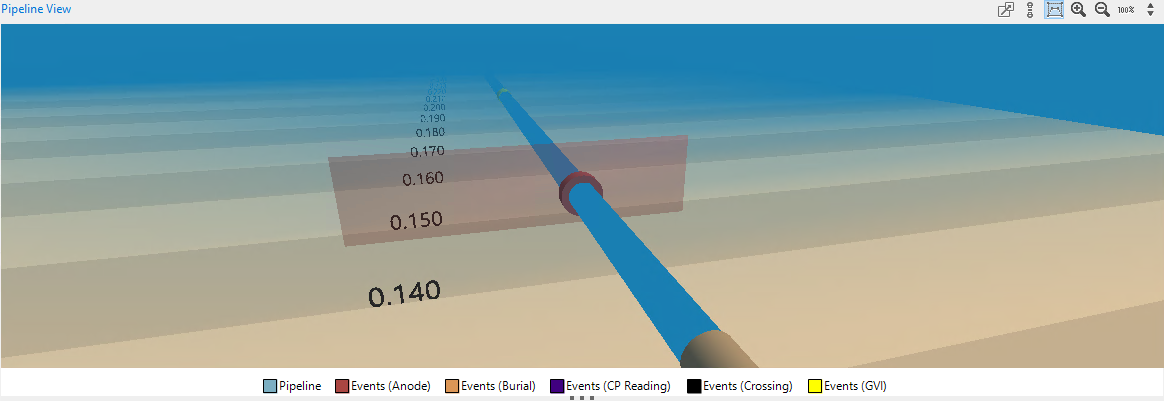
The Pipeline View chart is displayed on the INSPECTION screen on the Charts tab and it shows various events on a pipeline. The Pipeline View chart template is predelivered for NEXUS IC, however, to ensure that the pipeline and its events are displayed correctly in the Pipeline View chart, you must make a number of settings as described below.
Procedure
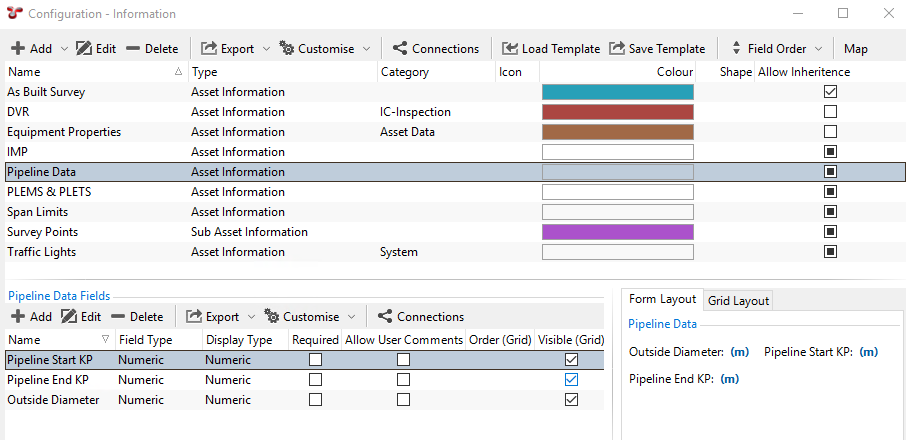
Ensure that you have an Asset Information Group (AIG) that stores your pipeline data and contains the following fields:
Pipeline Start KP
Pipeline End KP
Outside Diameter
For more information about setting up an AIG, see Configure Asset Information Groups.
Note
To make sure that there is actual pipeline data to be displayed in the chart, you must define values for these fields when maintaining this AIG.
Configure the Pipeline View chart template under as follows:
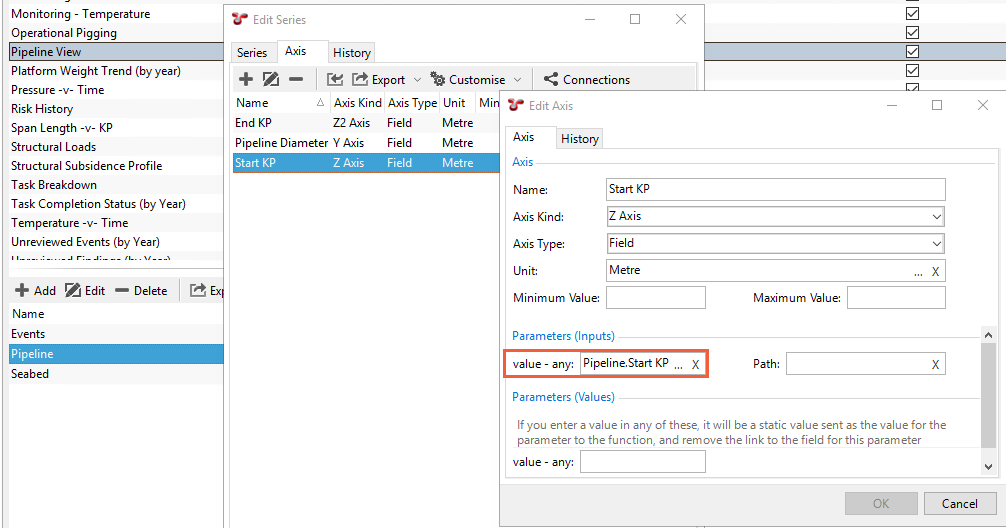
The axes of the Pipeline series must refer to the corresponding pipeline data AIG fields:
The Start KP (Z) axis must refer to the Pipeline Start KP AIG field:
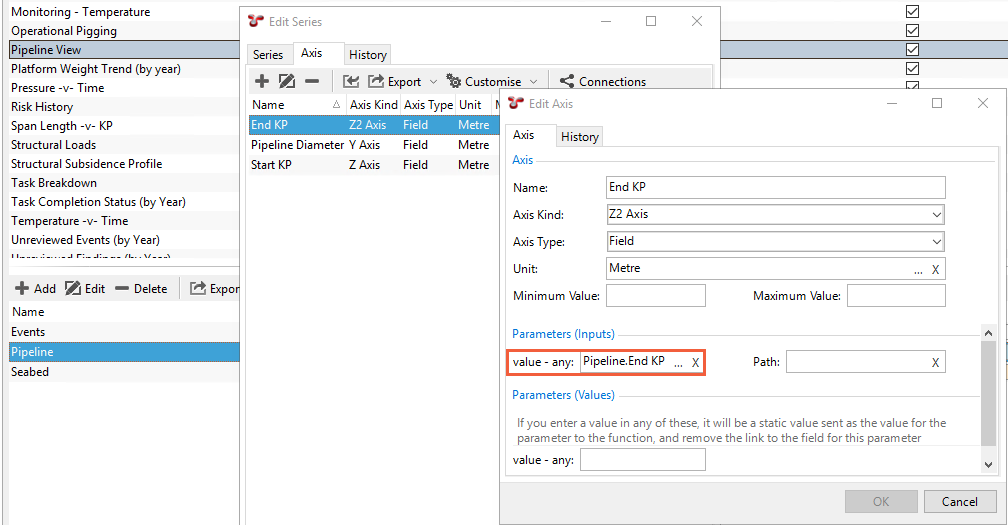
The End KP (Z2) axis must refer to the Pipeline End KP AIG field:
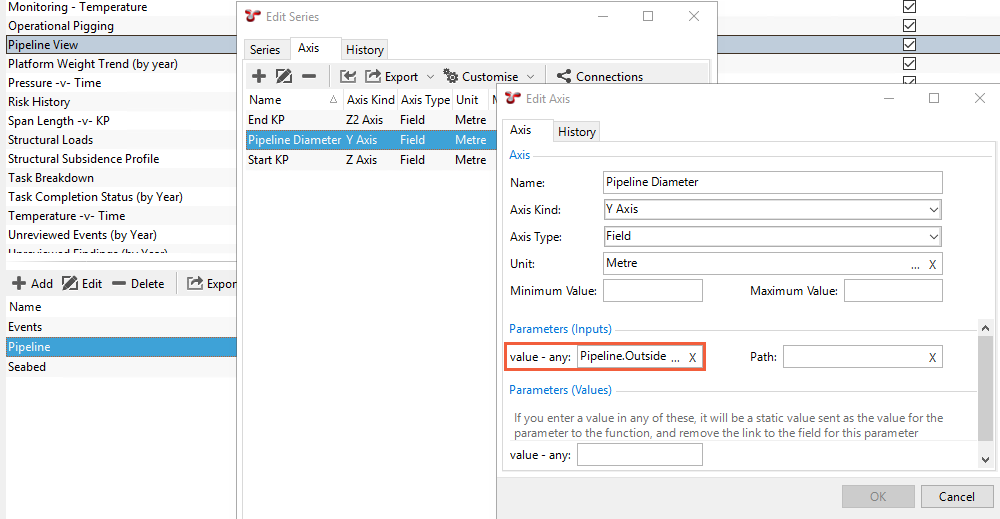
The Pipeline Diameter (Y) axis must refer to the Outside Diameter AIG field:
Similarly, the axes of the Events series must refer to the corresponding event fields and the pipeline diameter field:
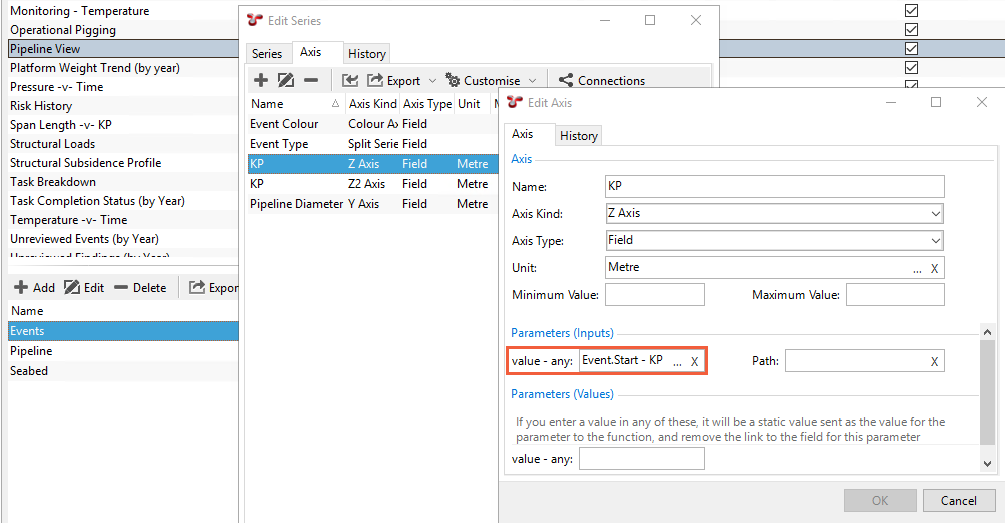
The KP (Z) axis must refer to the Event Start KP field:
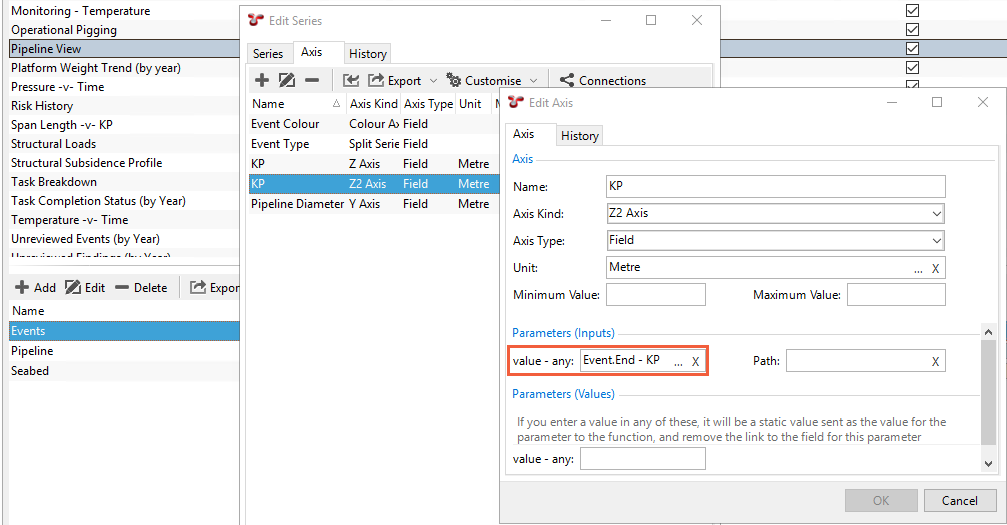
The KP (Z2) axis must refer to the Event End KP AIG field:
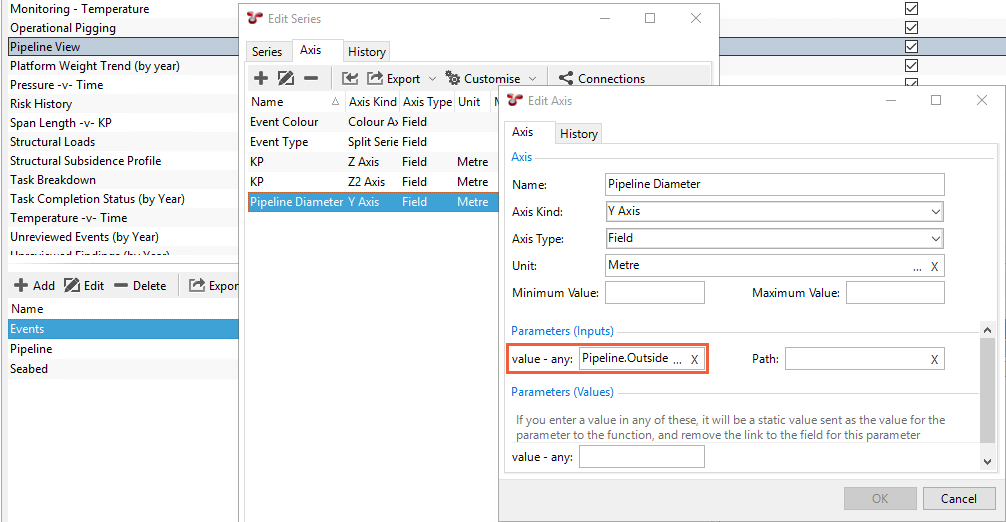
The Pipeline Diameter (Y) axis must refer to the Outside Diameter AIG field:
If you have imported post-processed profile data into the database, you can also perform field mapping for the Seabed series as required.
Note
Except for mapping fields, do not change other preconfigured values for the axes.
To ensure that NEXUS can determine the position of the event on the pipeline, map the Position - KP usage item to the relevant survey data field in the database under . The survey data field that you map to the Position - KP usage must correspond to the survey data field that stores the start and end KP values:
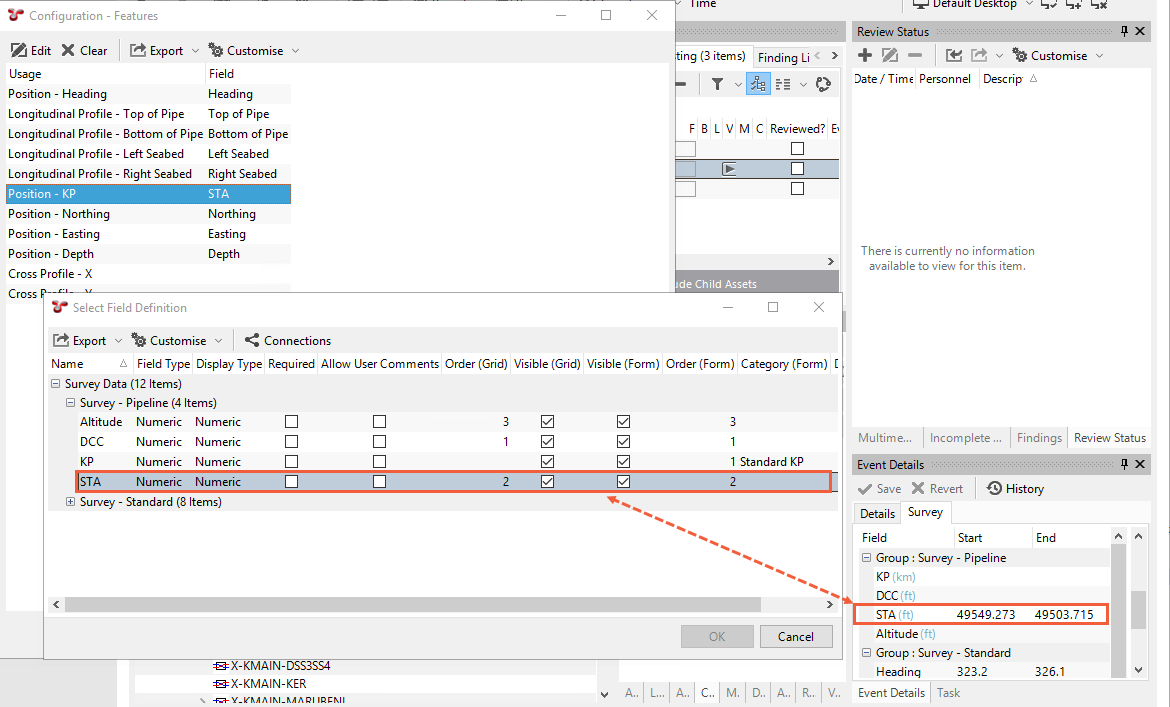
Note
To make sure that there is actual event data to be displayed in the chart, you must have defined values for the Start KP and End KP fields in your survey data under .
Once you have completed all the steps, close and reopen the database for the changes to take effect.
Note
In IC-Inspection, you may need to make a few more additional steps to get the chart displayed correctly. For more information, see Displaying Pipeline Views.
Result
The Pipeline View chart is now displayed correctly on the Charts tab including pipeline and events data: