Create Table of Data for Anomaly List, Apply Styles
In this step, you create a Table of Data that lists our anomalies. For that, you create the following:
An Element Group to include all the tables for anomalies
A level-2 Section Heading to be included in the output before the table
A Simple Source for the Anomaly system table, from which the Table of Data can retrieve data
The actual table of data for the Anomaly List applying different styles to it
See the detailed steps below:
Prerequisites
You have completed the following step:
Process
1. Insert an Element Group for the anomaly tables.
This element will contain the anomaly tables that we’re going to create.
Add an Element Group element to the Report Layout structure (see insertion methods in previous steps).
Tip
If the element is not inserted to the right location in the element structure, use the Move Up or Move Down buttons in the toolbar to move them to the correct place.
Double-click the element in the structure to edit it.
Enter the name Anomaly Tables, which will identify the element in the structure. You do not need to make other settings for the element group right now.
Click OK.
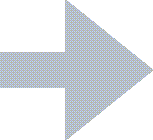
2. Insert a level-2 Section Heading for the list of anomalies.
Add a Section Heading element to the Report Layout structure so that it is included within the Anomaly Tables element group.
Double-click the element in the structure to edit it.
Enter a name that identifies the element in the structure, for example, Anomaly List Heading 2. This text does not appear in the actual report output.
Enter the text of the heading that you want to see in the output in the Content field. This time, we just want to use the heading List of Anomalies, but you can use right-click in this field if you want to add a variable.
Select the Include in Table of Contents checkbox to have this section heading appear in the Table of Contents.
In the Default Style field, select Heading 2, which is a preconfigured style that can be applied for level-2 section headings. If required, you can set up your own style and apply that instead (see Styles).
Click OK.
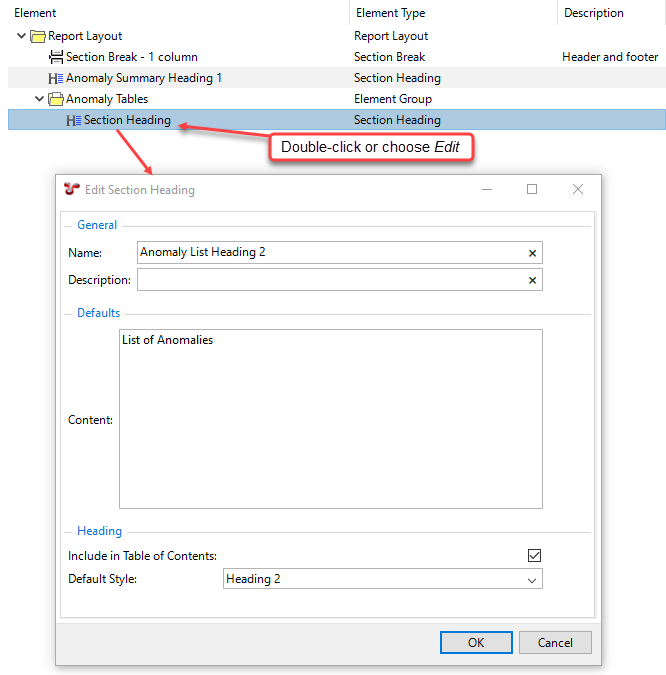
3. Insert a Simple Source for Anomalies.
This simple source will be used as the data source for the anomaly list Table of Data that we are going to create.
Add a Simple Source element to the Report Layout structure so that it is included within the Anomaly Tables element group. The Simple Source element is located under the SOURCES node within the Template Definition section of the dialog.
Note
You must insert the simple source within the element group, else, you cannot refer to it from the other elements of the element group.
Double-click the Simple Source element in the structure to edit it.
Specify the name Anomaly* for the simple source.
In the Table field, click the ellipsis
to select the System Table Anomaly.
Click OK.


4. Insert a Table of Data element for Anomaly Listing.
Add a Table of Data element to the Report Layout structure so that it is included within the Anomaly Tables element group and it is below the Section Heading element.
Double-click the element in the structure to edit it.
On the Properties tab, make settings as follows:
Name: Enter Anomaly Listing
Description: Enter a descriptive text, such as List of anomalies from Anomaly table
Tick the following checkboxes:
Show Caption
Fit Window
Hide Columns with No Values
Source: Select the Anomaly source from the drop-down list. The available values in this field are retrieved from the sources that have been created under the current element group.
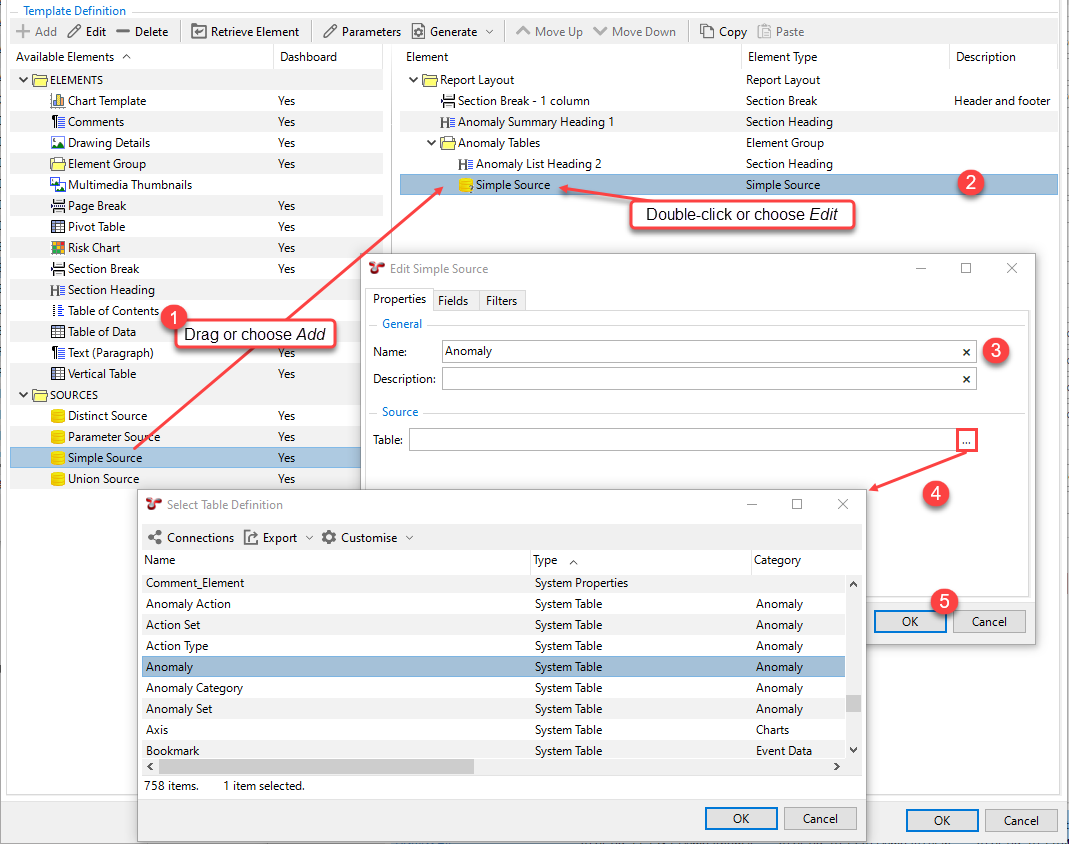
On the Layout tab, make settings for the column visibility, the category into which a column is assigned to and the layout as follows:
Change the visibility of the Action Overdue column to Yes and the Assigned To column to No by changing the respective values in the Visible column. This will ensure that the table will include the Action Overdue column, but it will not include the Assigned To column in the output.
Change the category of the Action Overdue column to Anomaly Details. You can do that by directly overwriting the current value in the Category column. This will change the category in the layout of the table in the RTF and HTML output. Categories are not visible in the Excel output.
At the bottom of the tab, you can see the layout of the table as it will appear in the output. Drag the Anomaly Number column before the Name column so that it appears as the first column within the Anomaly Details category.
Click the Asset column title. You can see that an arrow appears next to the column title. It indicates that the rows of the table will be sorted based on the values of the Asset column.
Click OK.
5. Apply a colour to specific rows of the table.
In the table of data, you want to highlight each row that contains an anomaly with the code CR (Crack) with orange colour. To do that, proceed as follows:
Double-click the Table of Data element in the structure to edit it again.
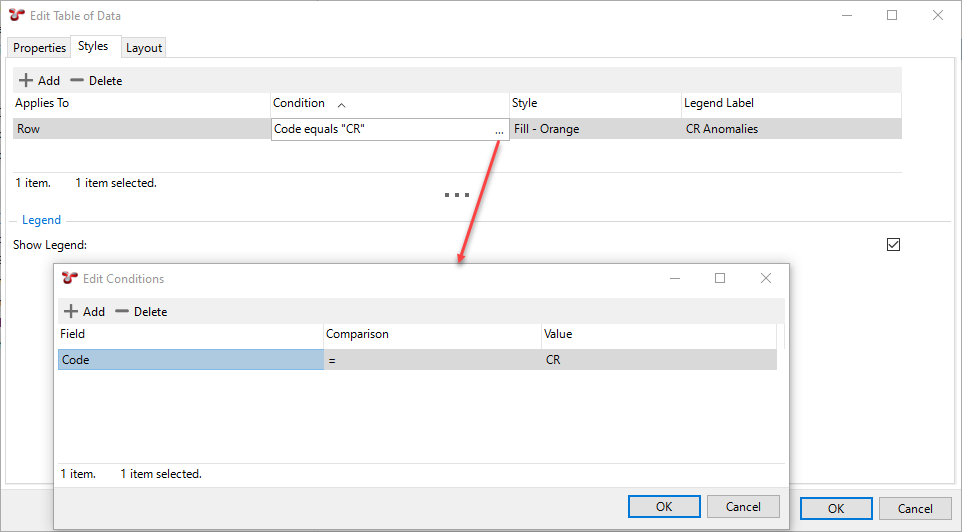
Go to the Styles tab.
Choose Add.
In the Applies To column, select Row.
Double-click in the Conditions column and click the ellipsis
In that dialog, choose Add.
Double-click in the respective columns to make the following settings:
Field column: Select the Code field
Comparison column: Select =
Value column: Click the ellipsis
Click OK.
Back on the Styles tab, in the Style column, select Fill – Orange to change the colour of the row to orange.
Note
The available styles are preconfigured. You can adjust or create new styles as described in Set Up Styles for Report Templates
In the Legend Label column, enter CR Anomalies. The orange colour and this text will be added as a legend at the bottom of the table.
Click OK.
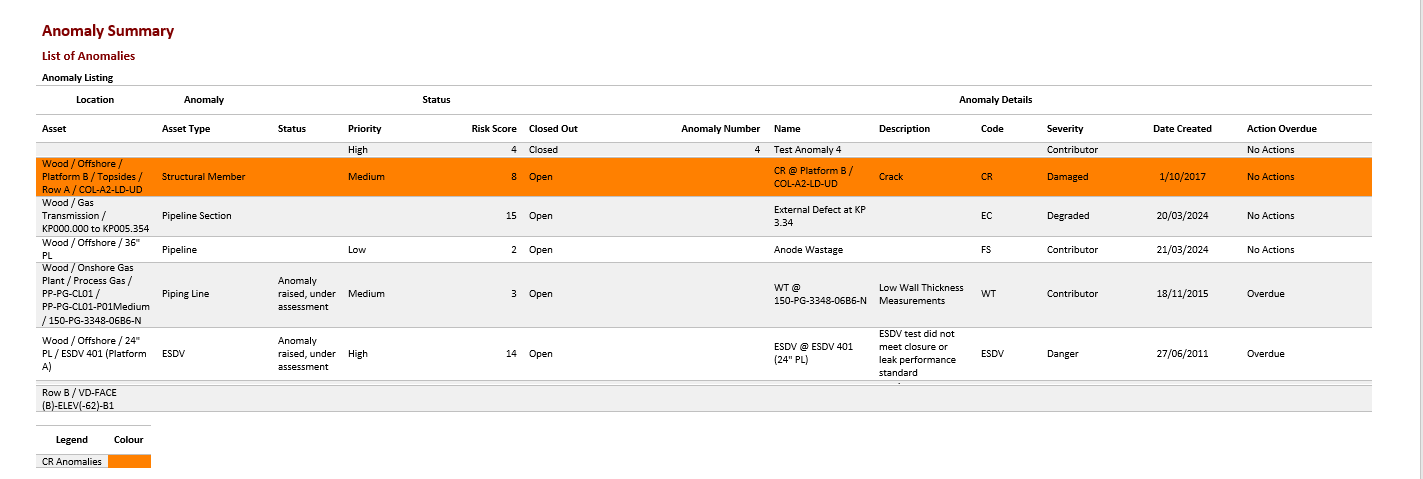
Result
In the output, the row of the anomaly with the code CR is now highlighted with orange colour and a legend is added at the bottom of the table:
6. Apply a colour to specific cells of the table.
Now, we want to highlight cells where the Priority column value is High with red colour. Still in the Edit Table of Data dialog for the Anomaly Listing table of data, proceed as follows:
On the Styles tab page, click Add.
In the Applies To column, select Cell from the drop-down list.
Double-click in the Conditions column and click the ellipsis
Add two conditions, one for the COLUMN NAME field that equals to Priority and one for the COLUMN VALUE field that equals to High:
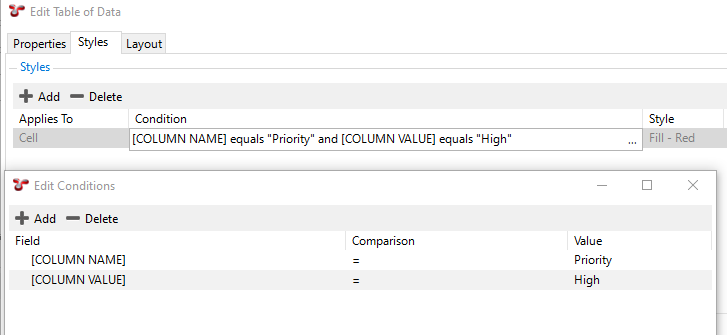
Click OK.
Back on the Styles tab, in the Style column, select the Fill - Red style.
In the Legend Label column, enter High Priority Anomalies. The red colour and this text will be added as a legend at the bottom of the table.
Click OK.
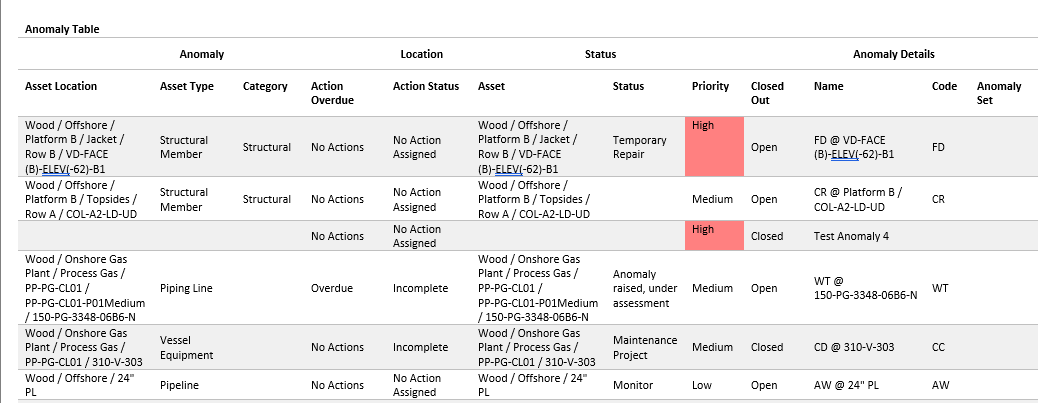
Result
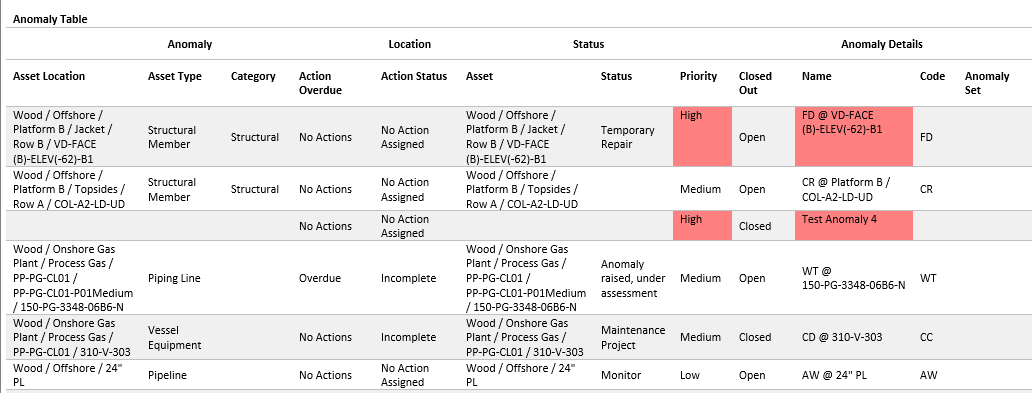
When you generate the output, in the Priority column, cells with the value High will be highlighted by red:
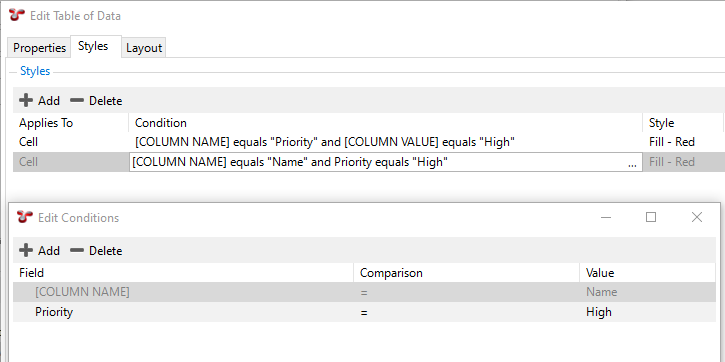
Let’s say that you also want to highlight the Asset Name cell for the items that have the Priority value High. In this case, follow the process above except that you create one condition for the COLUMN NAME field that equals to Name and one for the Priority field that equals to High:
Result
In this case, when you generate the output, the corresponding Name cell will be highlighted with red too:
Note
To add/edit/delete styles that you can apply, go back to the Configuration - Templates dialog and choose the Styles toolbar button.