Grouping
You can organise rows in the grid by grouping them based on the values of one or more columns. This helps create a structured, hierarchical view that makes data analysis easier.
Grouping by a Column
To group rows by a specific column:
Right-click the column header you wish to group by.
Select Group from the context menu.
Once a column is selected for grouping, a grouping panel appears at the top of the grid. This panel displays the active groupings and allows you to manage them.
Managing Groupings
From the grouping panel, you can:
Add additional grouping levels by clicking the plus [+] icon and selecting more columns.
Remove a grouping by clicking the close [×] icon next to the column name.
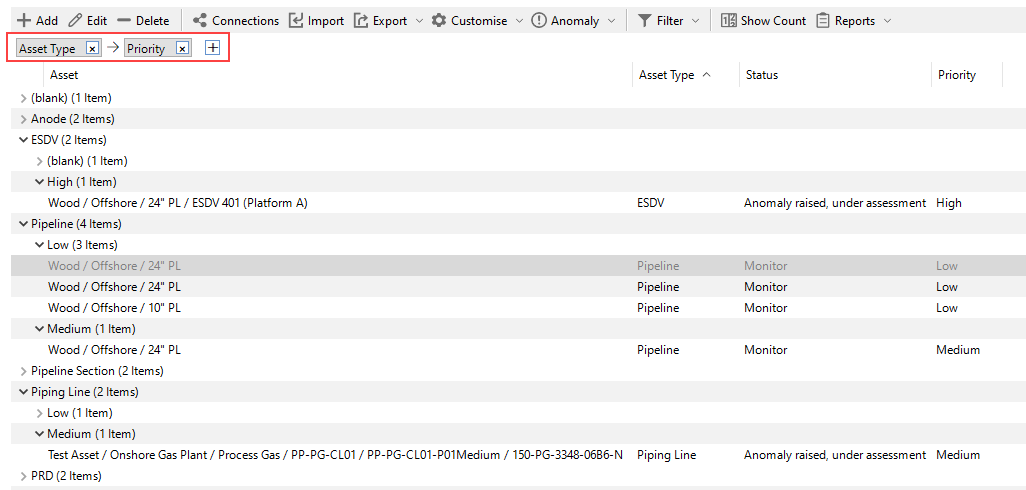
Example: Grouping Anomaly Records
Suppose you have a grid displaying anomaly records. To better analyse the data, you want to apply two levels of grouping:
First level: Group by Asset Type.
Second level: Within each asset type, group by Priority.
The resulting grid will display a hierarchical structure:
Top-level groups are based on Asset Type.
Within each asset type, records are further grouped by Priority.
The grouping panel at the top reflects this structure, showing both levels of grouping in order.
See also