Pipeline View
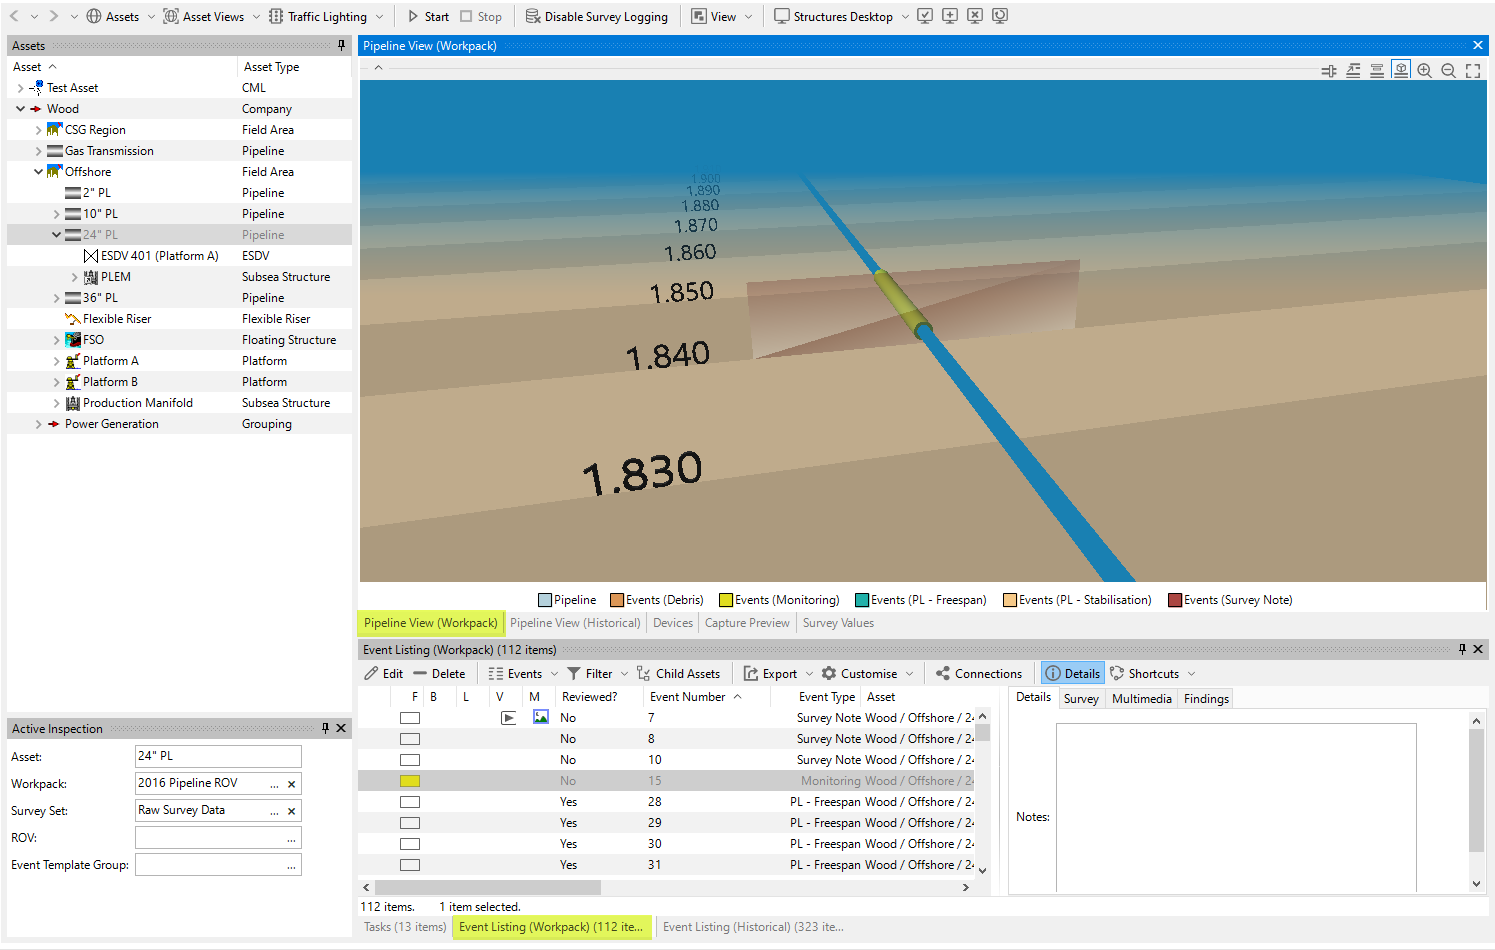
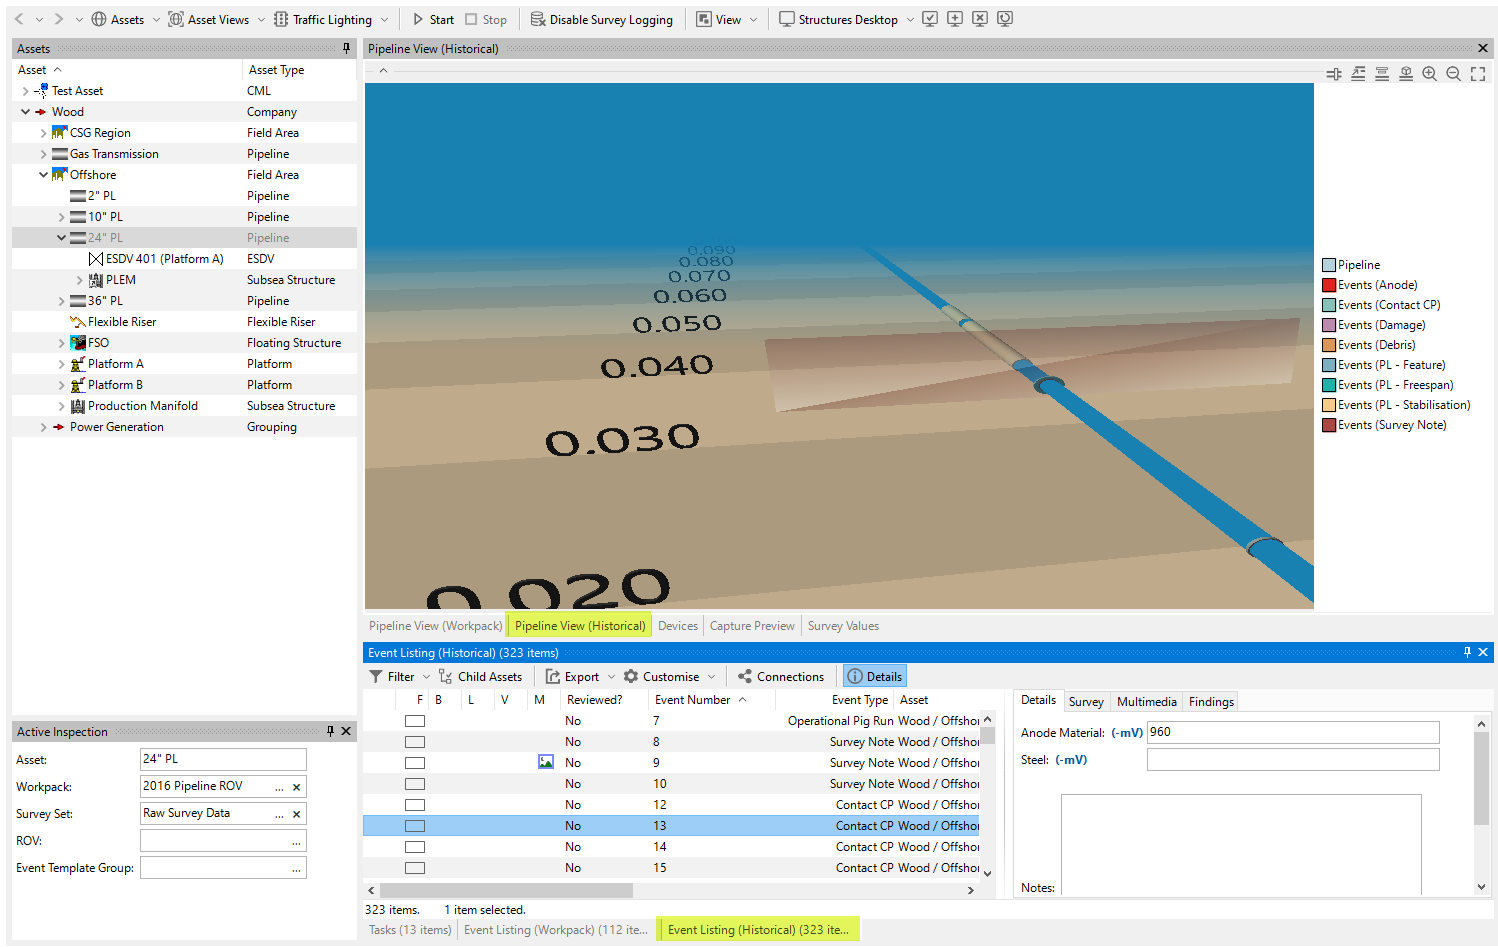
On the Pipeline View panes, you can see a special chart that shows events along your pipeline in a 3D view. Each event appears in the pipeline view when you click Save on the event form.
There are two Pipeline View panes in IC-Inspection:
Pipeline View (Workpack): This pane shows the pipeline view chart for the event selected on the Event Listing (Workpack) pane.
Pipeline View (Historical): This pane shows the pipeline view chart for the event selected on the Event Listing (Historical) pane.
The pipeline view can also show seabed profile (if you have any PL - Cross Profile data imported), and animates motion along the pipeline as you select events.
Prerequisites
To ensure that the Pipeline View (Workpack) and the Pipeline View (Historical) charts are displayed correctly, configurations must be made in NEXUS IC as described in Configure Pipeline View Chart.
Zooming
You can zoom in or out by clicking in the chart area and (with the mouse cursor still inside the chart area) spinning the mouse wheel.
You can also control zoom using the following toolbar buttons:
Button
Description

Zooms the image in.

Zooms the image out.

Resets to default zoom level.
Pipeline View Toolbar
In addition to the toolbar buttons for zooming, the following buttons are available, which are specific to the pipeline view chart:
Button
Description

Tracks the current KP. This button is only available in IC-Inspection. When selected, the pipeline view will move in time with the KP value coming in from survey. For NEXUS IC, see on the Inspections Toolbar.

Exaggerates the scale to show more of the pipeline. When selected, the scale of the pipeline will be distorted to make a greater KP range visible.

Toggles stacked series mode. When selected, events above the pipeline will be moved to make them more obvious. Different events will be moved up different distances so that all are easily distinguishable.

Toggles 3D perspective mode. When unselected, you will see the pipeline viewed from the side. When selected, you will see the pipeline viewed from above and slightly off to one side.
Displaying Pipeline Views
To ensure that the Pipeline View (Workpack) and the Pipeline View (Historical) charts are displayed correctly, in addition to the configurations in NEXUS IC (see Configure Pipeline View Chart), in IC-Inspection, you must perform the following steps:
Close and reopen the database in IC-Inspection whenever you have made a change to your Pipeline View chart configurations in NEXUS IC.
After reopening the database for the first time, perform the following:
For the Pipeline View (Workpack) chart, open the Event Listing (Workpack) pane before you check the chart on the Pipeline View (Workpack) pane, and ensure that events are listed there. This pane must be active so that the chart is displayed correctly on the Pipeline View (Workpack) pane:
For the Pipeline View (Historical) chart, open the Event Listing (Historical) pane before you check the chart on the Pipeline View (Historical) pane, and ensure that events are listed there. This pane must be active so that the chart is displayed correctly on the Pipeline View (Historical) pane:

