ANOMALIES Screen
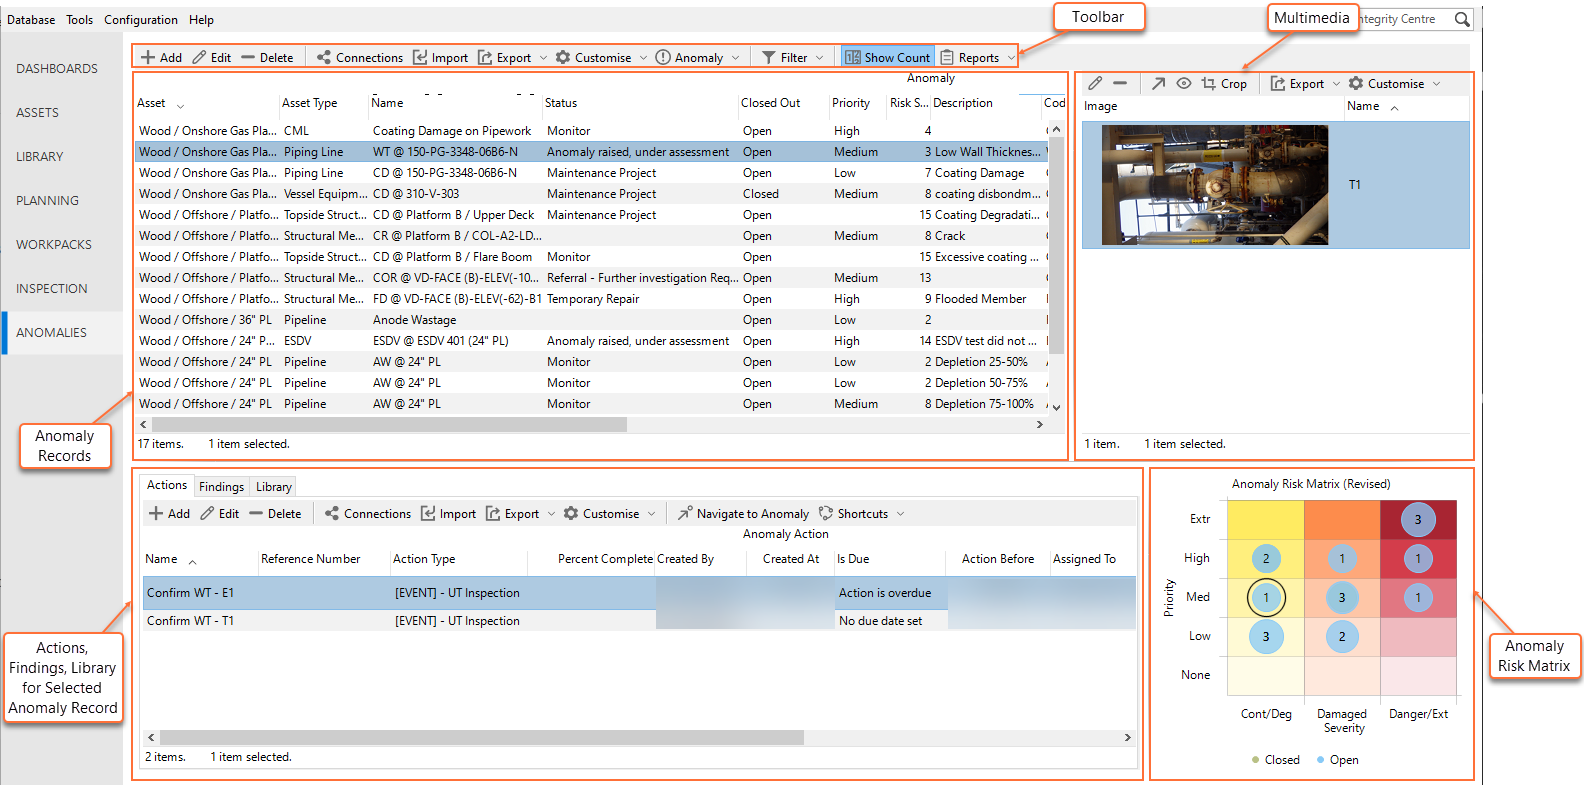
The ANOMALIES screen consists of the following main parts:
Screen Area |
Description |
|---|---|
|
See Anomalies Toolbar. |
|
This grid allows you to review and manage anomaly records (see Anomalies). It contains columns for the main anomaly parameters and additional calculated columns, such as Action Status and Action Overdue. |
|
Shows multimedia files that belong to the anomaly record selected on the left part of the screen (see Multimedia). You can toggle the visibility of this pane under the View toolbar option. |
|
Shown on the following tabs:
|
|
See Risk Chart. You can toggle the visibility of the Risk Chart pane under the View toolbar option. |


Filter Anomalies
You can filter anomaly records in the grid based on:
Workpacks - Choose from the toolbar to select the workpacks based on which you want to filter the anomalies. Workpacks are linked to anomalies via the linked findings and events.
Event Type - Choose from the toolbar to select the assets based on which you want to filter the anomalies. Assets are linked to anomalies by the asset chosen in the anomaly record itself AND by the linked findings and events.
Show Closed – Choose to toggle the visibility of closed anomalies in the grid.
When enabled, closed anomalies are shown.
When disabled (default), closed anomalies are hidden.
To clear all the filters by choosing from the toolbar.
Tip
Use the grid Grouping functionality to group and filter anomaly records. It is a quick and easy way to drill down to the anomalies that you are particularly interested in reviewing. All columns in the grid can also be filtered and sorted using the standard filtering (see Filtering) and sorting (see Sorting) functionality.
Anomalies Toolbar
For information about the main toolbar menu options on the ANOMALIES screen, see below:
Toolbar Option |
Description |
|---|---|
Creates a new anomaly. See Create Anomalies and Add/Edit Anomaly Dialog. |
|
Allows you to update the anomaly record. See Add/Edit Anomaly Dialog. You can also bulk update anomalies using the standard grid functions (see Multi-Edit). |
|
Deletes the records from the database. You can also bulk delete records using the standard grid functions (see Multi-Edit). |
|
Closes the anomaly. See Close Anomalies. |
|
Toggles the visibility of the Findings tab at the bottom of the screen. |
|
Toggles the visibility of the Library tab at the bottom of the screen. |
|
Toggles the visibility of the Multimedia pane on the top right part of the screen. |
|
Toggles the visibility of the Risk Chart pane on the bottom right part of the screen. The pane shows the Anomalies Risk Matrix (see Risk Chart). |
|
If the Risk Chart pane is visible, it toggles the visibility of the anomaly count values shown on the Anomalies Risk Matrix. |
|
Opens the anomaly filter options. See Filter Anomalies. |
|
Displays items that are linked to the selected anomaly. See Connections. |
|
Imports anomaly data into the database. See Import. |
|
Exports anomaly data from the active grid. See Export. |
|
Customises the grid layout and columns. See Customise. |
|
Generates reports based on anomaly data. See Reports. |