Create Simple Source with Filters and Looping Element Group
In our Asset Integrity Report, we want to display some data from the Pipeline AIG for specific assets. For each relevant asset, we want to see a vertical table that shows these pipeline data.
For this, we need an element group that loops on assets and contains a vertical table that retrieves data from the Pipeline AIG. The vertical table will then be filled with pipeline data for each filtered asset one by one when the report is generated.
In this step, you create a looping element group, which is linked to a simple source that filters the relevant assets. You can then create the actual vertical table in the next step.
See the detailed steps below:
Prerequisites
You have completed the following step:
Process
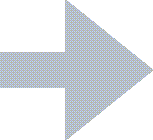
1. Insert a simple source for Asset Location.
Add a Simple Source element to the Report Layout structure (drag or select it and choose Add). The Simple Source element is located under the SOURCES node within the Template Definition section of the dialog.
Double-click the Simple Source element in the structure to edit it.
On the Properties tab, specify the name Anomaly* for the simple source.
In the Table field, click the ellipsis
to select the System Table Anomaly.
Click OK.
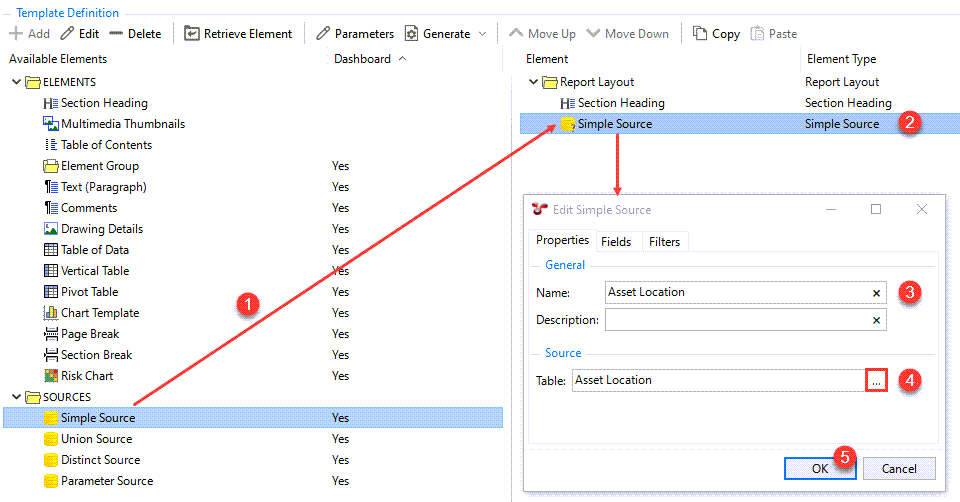


2. Add an asset tree filter to the Asset Location simple source.
We want to allow the user to filter based on a specific branch of the asset tree. When generating the report, the user will see a selection dialog where they can select the required asset tree branch.
To do that, update the simple source as follows:
Double-click the Asset Location Simple Source and go to the Filters tab.
Under Field, use the drop-down list to select the VN_ID field.
Note
The drop-down list includes all the fields from the Asset Location table that is linked to this simple source.
VN_ID is the unique identifier of an asset in the hierarchy. When you select this field, an additional value becomes available under Comparison, called Is Child Of.
Under Comparison, choose Is Child Of, which allows returning assets under a specific node within the asset tree.
Under Parameter, select User, which indicates that the user has to select the specific VN_ID value when generating the report.
Under Value, enter VN_ID.
Choose OK.
3. Add filters for asset name and asset type.
In addition to the filtering added to the Asset Location simple source above, we want to filter on assets that fulfill either of the following criteria:
They have PL in their asset name
They have the asset type Pipeline, Pipeline Section, Piping Circuit or Piping Line
Still on the Filters tab of the Edit Simple Source dialog, click the + (plus) sign at the end of the first filter to create a new filter.
Specify the following values for the filter:
Field: Since we want to filter assets that have PL in their asset name, select the Name field from the drop-down list.
Comparison: Select Like, which is a “contains” operator relevant for alphanumeric fields.
Value: Enter %PL%, which refers to any name that contains PL.
We now have the second filter set up.
Click the + (plus) sign at the end of the second filter to create a new filter.
Specify the following values for the filter:
Field: Since we want to filter assets based on their asset type, select the Asset Type field from the drop-down list.
Comparison: Select In, which allows multiple selections for asset type, that is, this would return any asset that has either of the selected asset types.
Value: Use the
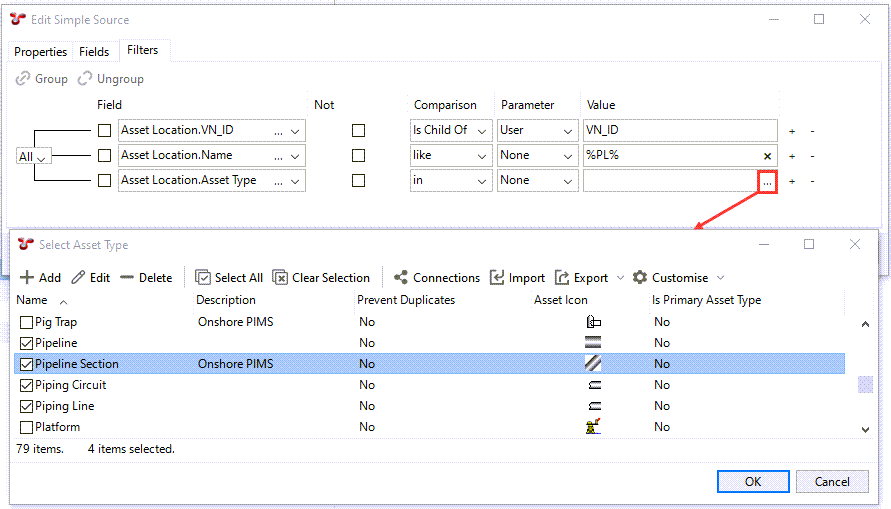
We now have the third filter set up.
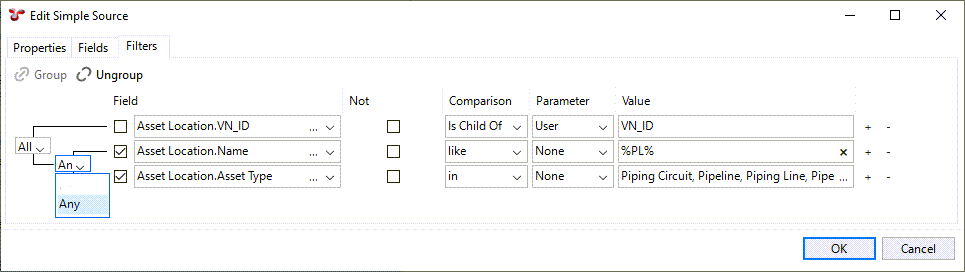
While we want the first filter for VN_ID to be always applied, at the same time, we want EITHER the second OR the third filter to be applied. That is, we want assets to be returned if either they have PL in their asset name, or they have the specified asset types. To make this possible, we need to group the second and third filter with an Any connector:
Under Field, select the checkboxes next to the second and third filters. The Group and Ungroup toolbar buttons become available.
Choose Group.
A new grouping is created for these two filters, with a drop-down option. Select Any.
Choose OK.
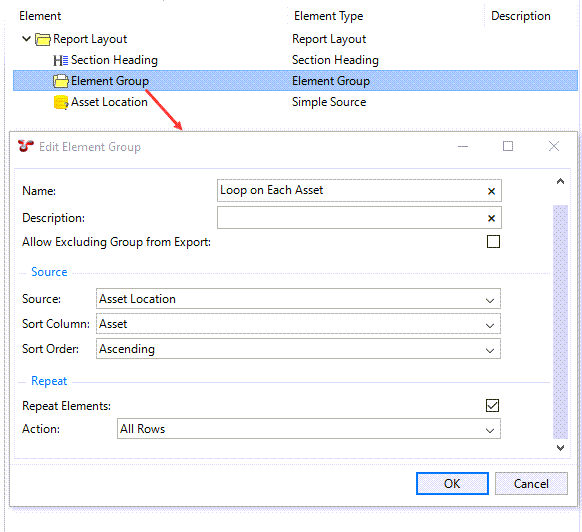
4. Insert an element group that loops on assets.
Add an Element Group element to the Report Layout structure right after the Section Heading.
Tip
If the element is not inserted to the right location in the element structure, use the Move Up or Move Down buttons in the toolbar to move them to the correct place.
Double-click the element in the structure to edit it.
Enter data as follows:
Name: Enter a descriptive name, such as Loop on Each Asset.
Source: Select the Asset Location source that you created in the previous step.
Sourt Column: Select, for example, Asset, which means that data will be sorted based on the Asset column of the Asset Location table.
Sourt Order: Select Ascending.
Repeat Elements: Tick the checkbox.
Action: Select All Rows to repeat elements for all the rows in the source.
Click OK.