Add Risk Charts with Element Group, Page Break, Section Heading
In the next part of the report, you want to include two risk charts based on different risk models and you want to include them next to each other on a new page. For that, you create the following:
An Element Group to include all the Risk Charts
A Page Break element with 2 columns
A level-2 Section Heading to be included in the output before the risk charts
A Simple Source for the Risk Assessment system table, filtering for Generic Qualitative risk models
A Simple Source for the Risk Assessment system table, filtering for API 580 Qualitative risk models
The actual crisk charts
See the detailed steps below:
Prerequisites
You have completed the following steps:
Process
1. Insert an Element Group for the risk charts.
This element will contain the charts that we’re going to create.
Add an Element Group element to the Report Layout structure. It should be on the same level as the element group you created for the looping element group.
Tip
If the element is not inserted to the right location in the element structure, use the Move Up or Move Down buttons in the toolbar to move them to the correct place.
Double-click the element in the structure to edit it.
Enter the name Risk Charts, which will identify the element in the structure. You do not need to make other settings for the element group right now.
Click OK.
2. Add a Page Break element to place the charts on a new page and set up its layout.
You want the risk charts to appear on a new page and next to each other in two columns. To do that, proceed as follows:
Add a Page Break element to the Report Layout structure so that it is included within the Risk Charts element group.
Double-click the element in the structure to edit it.
Enter a name that identifies the element in the structure, for example, Page Break - 2 column.
In the Section Columns field, enter 2.
Under Page, select the Landscape for the Layout and A4 for Page Size.
Click OK.
3. Insert a level-2 Section Heading for the risk charts.
Add a Section Heading element to the Report Layout structure so that it is included within the Charts element group.
Double-click the element in the structure to edit it.
Enter a name that identifies the element in the structure, for example, Charts Heading 2. This text does not appear in the actual report output.
Enter the text of the heading that you want to see in the output in the Content field. This time, we just want to use the heading Risk Charts, but you can use right-click in this field if you want to add a variable.
Select the Include in Table of Contents checkbox to have this section heading appear in the Table of Contents.
In the Default Style field, select Heading 2, which is a preconfigured style that can be applied for level-2 section headings. If required, you can set up your own style and apply that instead (see Styles).
Click OK.
4. Insert a Simple Source for the Generic Qualitative Risk Model.
This simple source will be used as the data source for the Generic Qualitative risk model that we are going to create.
Add a Simple Source element to the Report Layout structure so that it is included within the Risk Charts element group. The Simple Source element is located under the SOURCES node within the Template Definition section of the dialog.
Note
You must insert the simple source within the element group, else, you cannot refer to it from the other elements of the element group.
Double-click the Simple Source element in the structure to edit it.
Specify the name Risk Assessment Generic* for the simple source.
In the Table field, click the ellipsis
to select the System Table Risk Assessment.
On the Filters tab, create 2 new filters:
A filter for user parameter VN_ID, in the same way as described in 2. Add an asset tree filter to the Asset Location simple source..
Another filter with the following data:
Field: Risk Model
Comparison: =
Parameter: None
Value: Generic Qualitative
Click OK.

5. Insert a Simple Source for the API 580 Qualitative Risk Model.
This simple source will be used as the data source for the API 580 Qualitative risk model that we are going to create.
Add a Simple Source element to the Report Layout structure so that it is included within the Risk Charts element group. The Simple Source element is located under the SOURCES node within the Template Definition section of the dialog.
Note
You must insert the simple source within the element group, else, you cannot refer to it from the other elements of the element group.
Double-click the Simple Source element in the structure to edit it.
Specify the name Risk Assessment API 580* for the simple source.
In the Table field, click the ellipsis
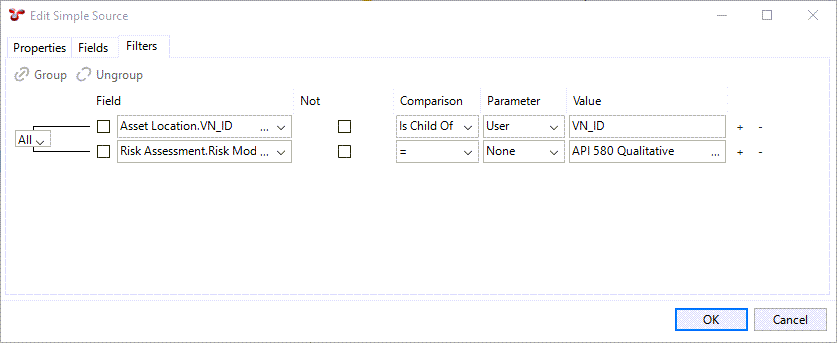
On the Filters tab, create 2 new filters:
A filter for user parameter VN_ID, in the same way as described in 2. Add an asset tree filter to the Asset Location simple source..
Another filter with the following data:
Field: Risk Model
Comparison: =
Parameter: None
Value: API 580 Qualitative
Click OK.
6. Insert a Generic Qualitative Risk Model.
Add a Risk Model element to the Report Layout structure so that it is included within the ** Risk Charts** element group.
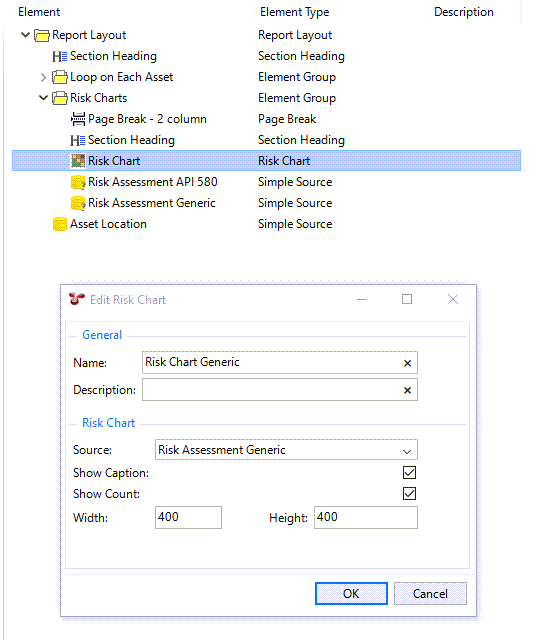
Double-click the element in the structure to edit it.
Enter data as follows:
Name: Enter Risk Chart Generic or any name that identifies the element in the structure.
Source: Select Risk Chart Generic source
Show Caption: Tick to add the name of the risk chart as a caption
Show Count: Tick to show the number of risk results in each square that has risk results.
Width: 400
Height: 400
Click OK.
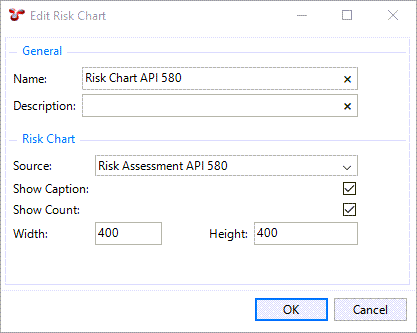
7. Insert an API 580 Qualitative Risk Model.
Add a Risk Model element to the Report Layout structure so that it is included within the ** Risk Charts** element group.
Double-click the element in the structure to edit it.
Enter data as follows:
Name: Enter Risk Chart API 580 or any name that identifies the element in the structure.
Source: Select Risk Chart API 580 source
Show Caption: Tick to add the name of the risk chart as a caption
Show Count: Tick to show the number of risk results in each square that has risk results.
Width: 400
Height: 400
Click OK.
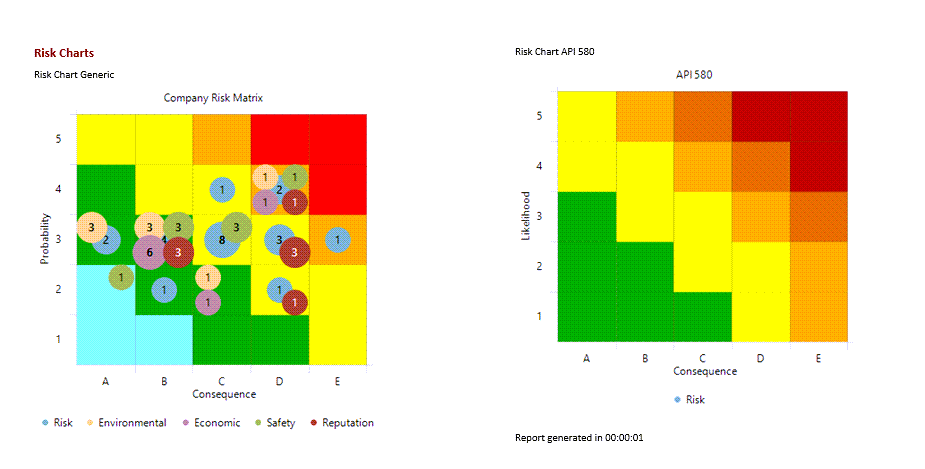
Result
When you generate the output, you can see that the risk charts are inserted next to each other in two columns: