Risk Chart
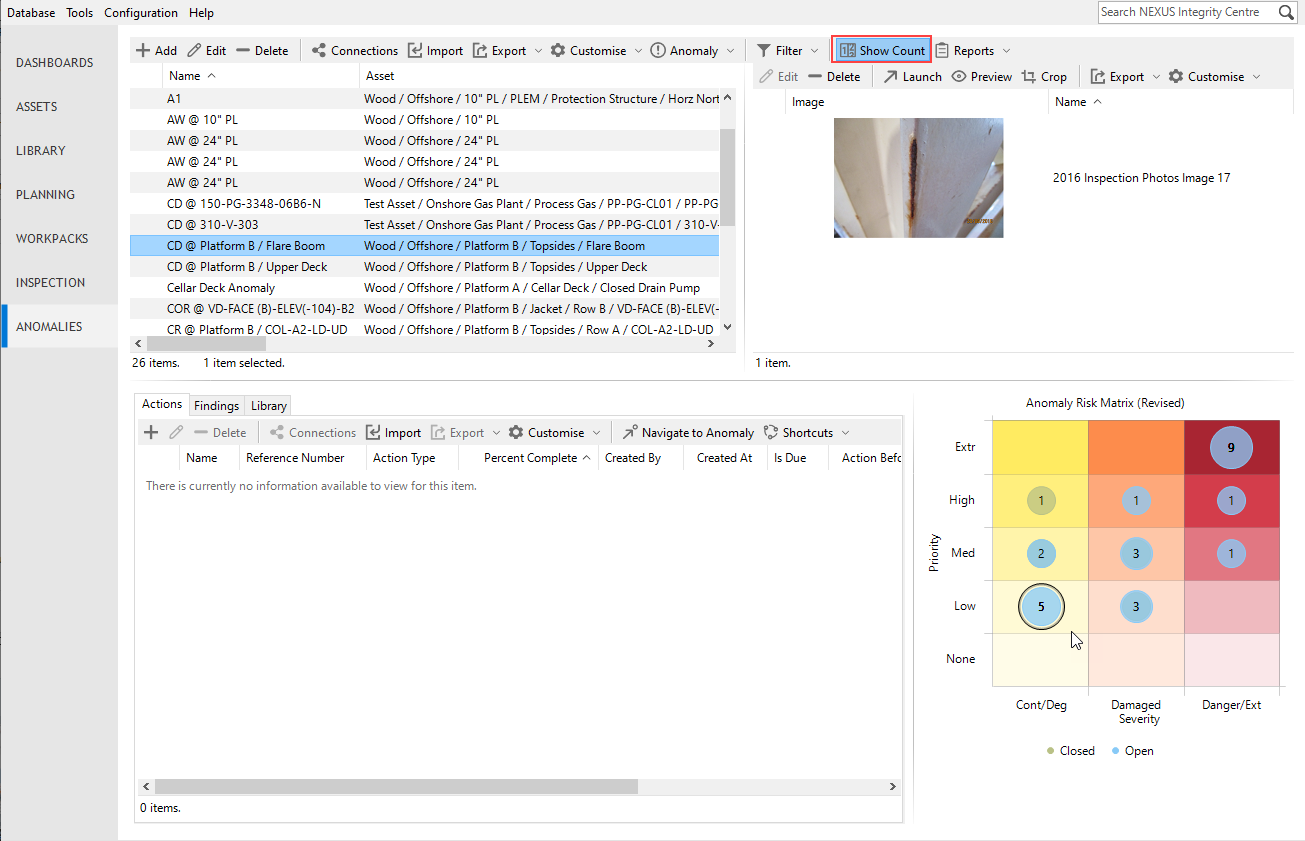
On the ANOMALIES screen, you can display the risk assessment results for anomalies on a risk matrix, which is visible at the right or bottom right of the screen. The visibility of this pane can be toggled on or off under the View toolbar option.
Prerequisites
To enable displaying the risk matrix for anomalies, you must set it up as described in Set Up Anomaly Risk Matrix.
Display Options
When displaying the risk matrix, note the following:
Where there are several risks at the same location in the chart, the dot will be shown larger.
Clicking on an anomaly or anomalies in the grid highlights that item in the risk matrix. Similarly, clicking on a result indicator in the matrix will highlight the relevant anomaly or anomalies in the grid.
The matrix legend is displayed below the chart, with coloured indicators for open and closed anomalies. Legend keys can be clicked to toggle showing their corresponding anomalies on the matrix.
If you want to see the total number of risk assessments at the specific locations of the risk models, click Show Count under the View toolbar option.