Create Section Heading, Vertical Table with Extended Simple Source
In this step, you create a Vertical Table that retrieves data from a Simple Source linked to the Pipeline AIG and has additional fields added to it. Since the Vertical Table is in a looping element group, it will be repeated for each asset that the element group loops on. You also want to create a section heading that shows the asset full location as the title for each table.
For that, you create the following:
A level-2 Section Heading to be included in the output before the tables and has a variable for the asset location in its content.
A Simple Source that gets data from the Pipeline Asset Information table plus you add extra fields to it from other tables. The Vertical Table will retrieve data from this Simple Source.
The actual vertical table
See the detailed steps below:
Prerequisites
You have completed the following steps:
Process
In this example, you work in the Loop on Each Asset Element Group that you have created in the previous step.
1. Insert a Simple Source for Pipeline AIG and add an extra field.
This Simple Source will be used as the data source for the Vertical Table that we are going to create. We link this Simple Source to the Pipeline Asset Information table, however, that table doesn’t contain the Full Location field, which we want to show in the table as well as in the Section Heading for each table, so we need to extend the Simple Source with that field.
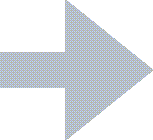
Add a Simple Source element to the Report Layout structure so that it is included within the Loop on Each Asset element group. The Simple Source element is located under the SOURCES node within the Template Definition section of the dialog.
Note
You must insert the simple source within the element group, else, you cannot refer to it from the other elements of the element group.
Double-click the Simple Source element in the structure to edit it.
Specify the name Pipeline AIG* for the simple source.
In the Table field, click the ellipsis
to select the Asset Information Table Pipeline.
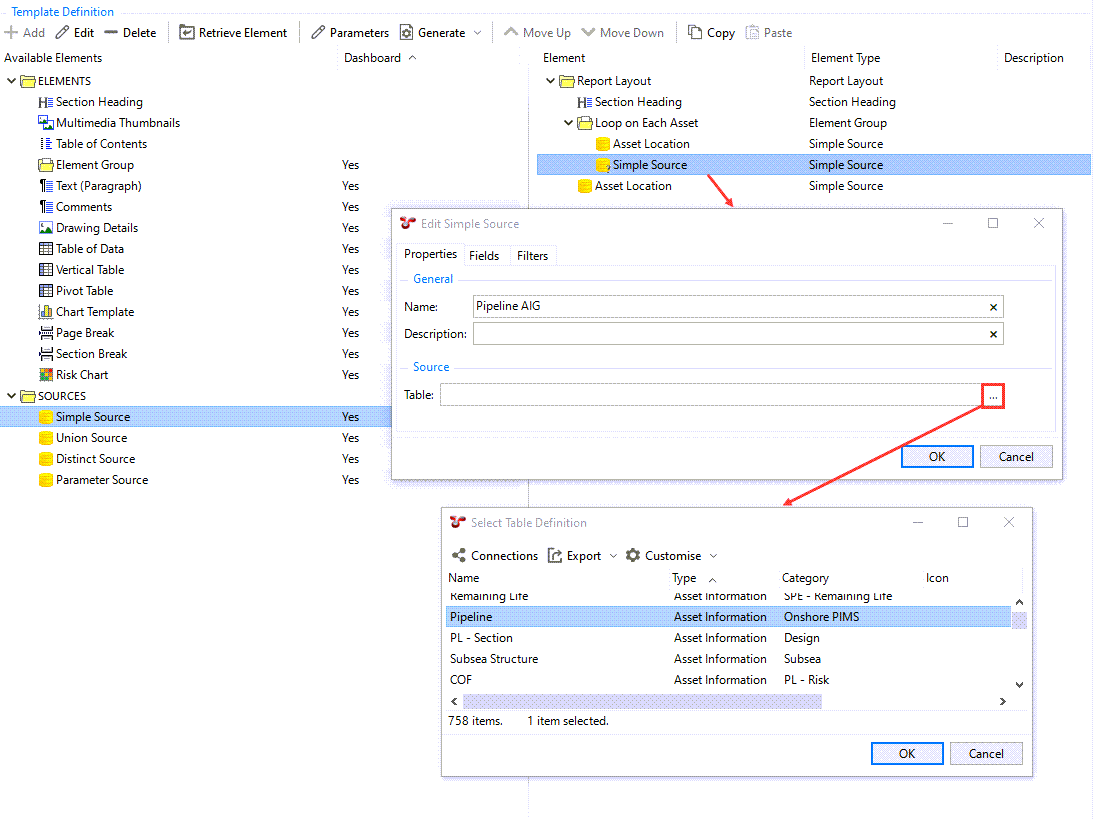
On the Filters tab, add a filter for VN_ID similarly to the Simple Source you created for the Asset Location Element Group, but now, use the parameter Group to ensure that the VN_ID is determined from the Simple Source used for the Element Group, which was the Asset Location Simple Source.
2. Add an extra field to the Simple Source.
Still in the Edit Simple Source dialog, go to the Fields tab.
If the Show Local Columns button is enabled, you can see the list of all fields that the linked Pipeline table contains.
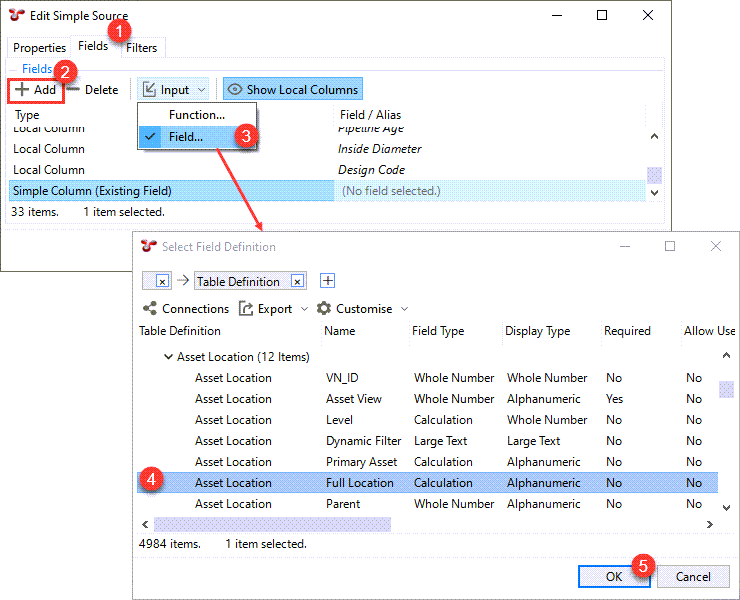
Click Add to add an extra field to the Simple Source.
You can see that a Simple Column entry has been added but with no field selected.
Right-click the row, or choose Input from the toolbar and choose Field…, which brings up a new dialog.
Select the Full Location field under the Asset Location system table.
Click OK.


3. Insert a level-2 Section Heading for the vertical tables.
You want to create a heading for each vertical table, which shows the Full Location value for each asset that the given vertical table is related to. Since you have added this field to the Simple Source you created in the previous step, you can refer to it from the Section Heading element.
Add a Section Heading element to the Report Layout structure so that it is included within the Loop on Each Asset element group.
Double-click the element in the structure to edit it.
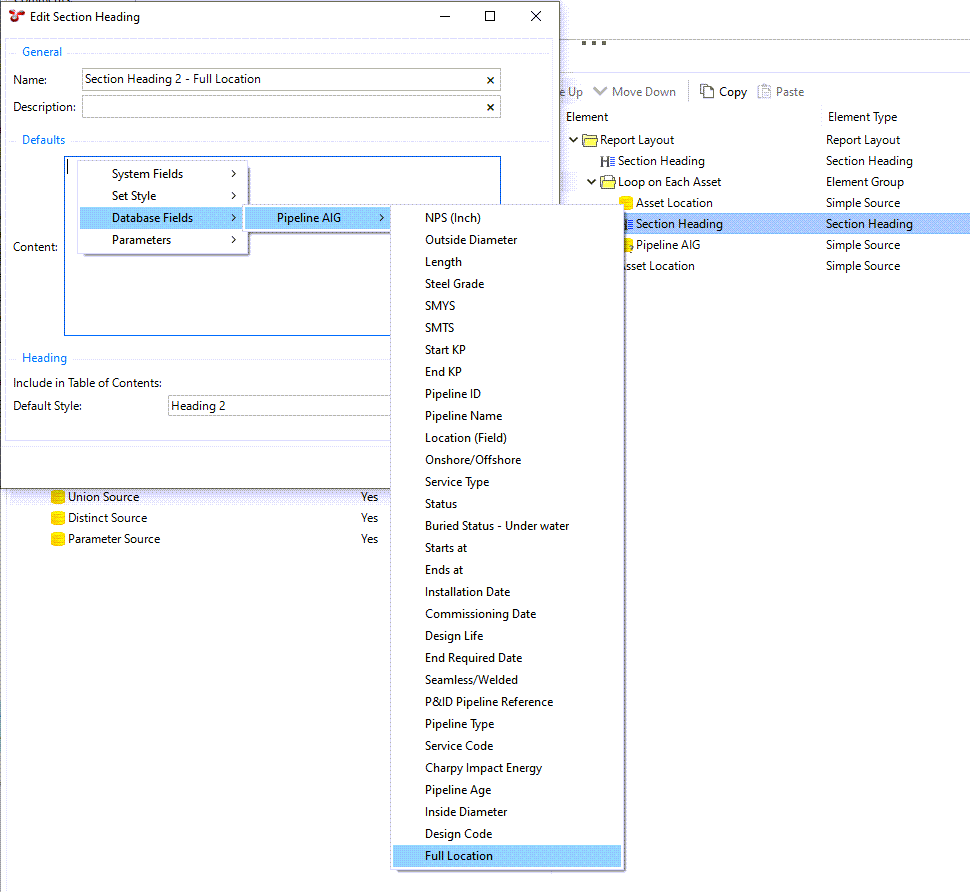
Enter a name that identifies the element in the structure, for example, Section Heading 2 - Full Location. This text does not appear in the actual report output.
Right-click in the Content field and choose to select the field that you have added to the Simple Source earlier.
Select the Include in Table of Contents checkbox to have this section heading appear in the Table of Contents.
In the Default Style field, select Heading 2, which is a preconfigured style that can be applied for level-2 section headings. If required, you can set up your own style and apply that instead (see Styles).
Click OK.
4. Insert a Vertical Table for pipeline data.
Add a Vertical Table element to the Report Layout structure so that it is included within the Loop on Each Asset element group and it is below the Section Heading element that you created in the previous step.
Double-click the element in the structure to edit it.
On the Properties tab, make settings as follows:
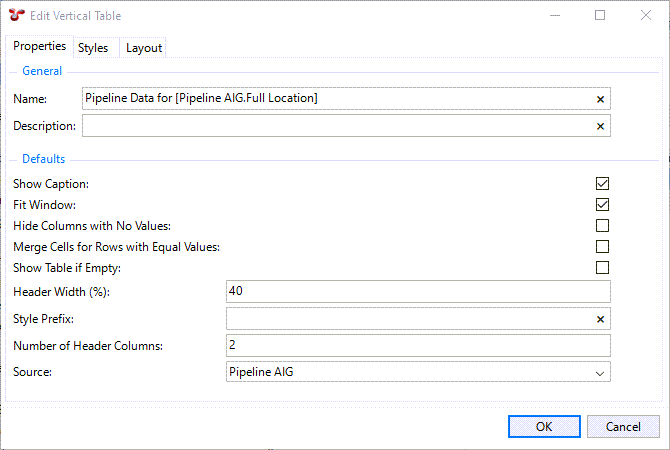
Name: Enter Pipeline Data for then right-click and select so that the name of the table, which will be used as a caption, includes the full location of the asset to which the table is related to.
Tick the following checkboxes:
Show Caption
Fit Window
Header Width (%): Enter 40, which means that the width of the header column will be 40% of the width of the whole table width.
Number of Header Columns: Enter 2, so that the fields of the table are arranged in two columns. Using more columns is recommended when you have lots of fields to display.
Source: Select the Pipeline AIG source from the drop-down list. The available values in this field are retrieved from the sources that have been created under the current element group.
On the Layout tab, you can hide columns or rearrange the layout as required.
Click OK.
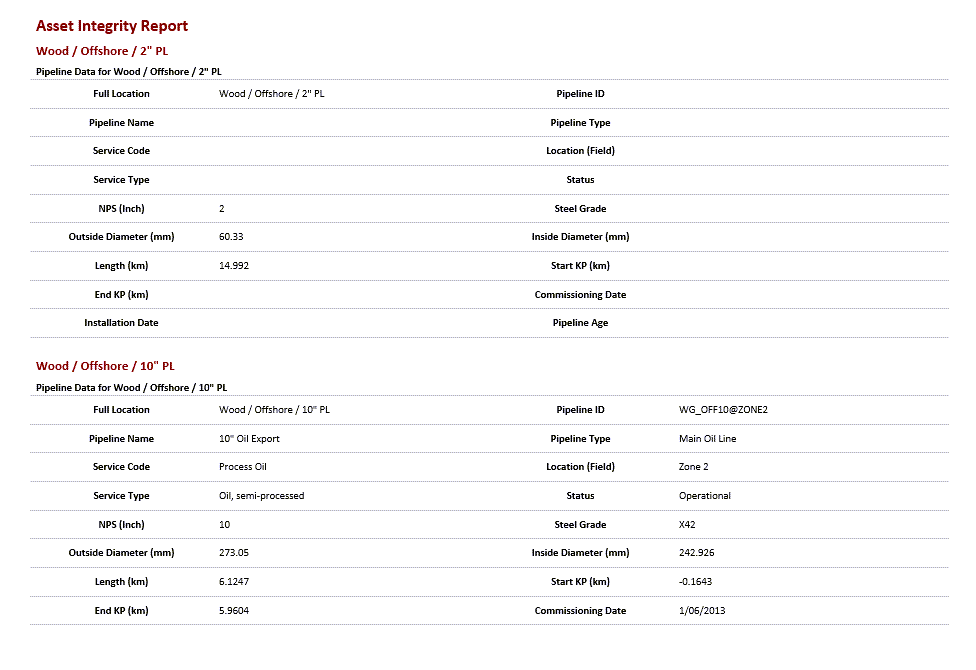
Result
When you generate the output, you are prompted to select a branch in the asset tree and in the output, you can see that vertical tables are inserted for each relevant asset containing data from the Pipeline AIG as well as the extra Full Location* field that you have added. Data is arranged in two columns and the headings and captions show the full location of the asset: