NEXUS IC Screen
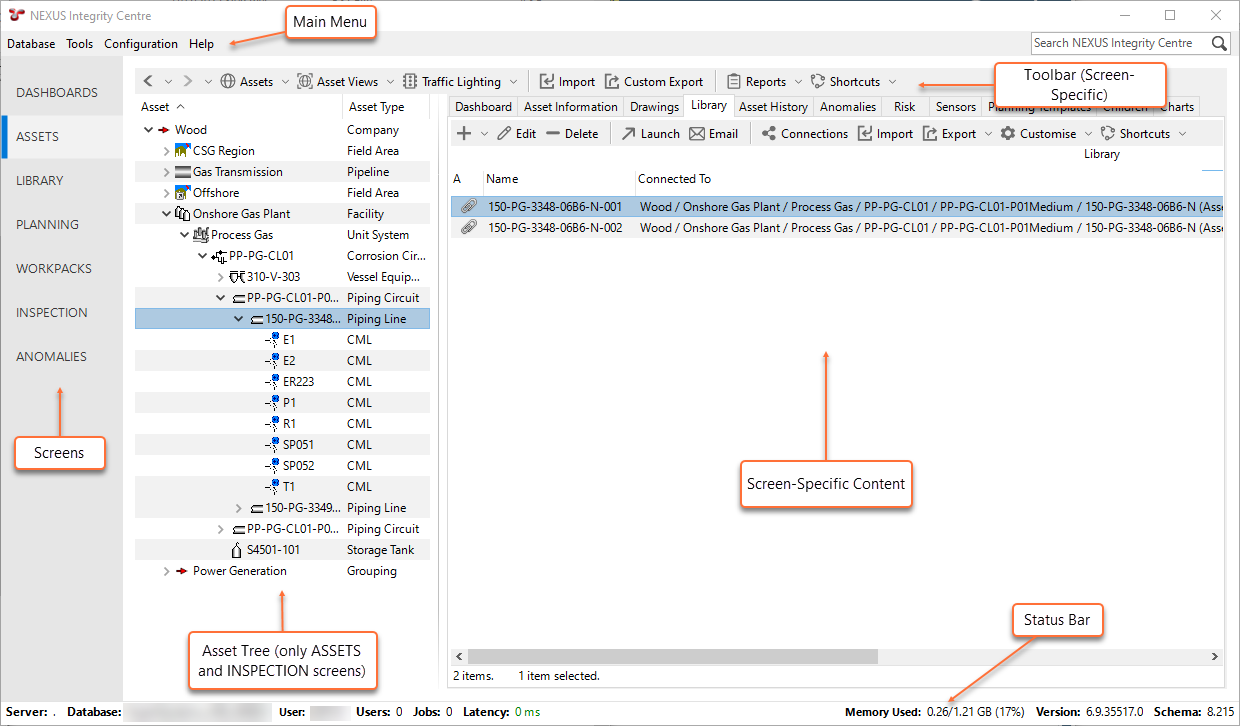
The NEXUS IC interface consists of several key components designed to support efficient navigation and task execution.
 Main Menu
The main menu provides access to configuration and system-level functions, including:
Database Settings: Manage database connections, user settings, and system-level operations. See Database.
Configuration Options: Adjust application-level settings and preferences. See Configuration.
Tools Menu: Access utilities that influence or monitor general application behaviour. See Tools.
If you need help, you can use the Help menu to access the documentation or to contact NEXUS Support.
 Search
The search box provides access to the NEXUS IC database-wide search functionality, allowing you to locate records and information across the database from anywhere within the application. For detailed information about the search funtionality, see Searching.
 Primary Screens
The sidebar provides access to the primary screens of NEXUS IC. These screens are available whenever the application is opened and provide access to the core functionality of the system.
The following primary screens are available:
Screen |
Description |
Screen Description |
|---|---|---|
DASHBOARDS |
Displays the output from any report template that you have configured in the report template library and marked as a Dashboard. For more information, see Dashboards. |
|
ASSETS |
Allows you to access the asset tree where you can view and manage all the asset information stored in the NEXUS IC database. For more information, see Asset Data Management. |
|
LIBRARY |
Allows you to manage library items. Library items are electronic documents that can be linked to data and data types in NEXUS IC. For more information, see Library. |
|
PLANNING |
Shows tasks against their asset, in calendar form. You can maintain tasks, planning templates, risks or shutdowns from this screen. For more information, see Planning and Workpacks. |
|
WORKPACKS |
Allows you to maintain workpacks, which are collections of tasks or events. For more information, see Workpacks. |
|
INSPECTION |
You can upload, analyse, chart and review inspection event data from this screen. For more information, see Inspection. |
|
ANOMALIES |
You can maintain anomalies from this screen. Anomalies are records that identify discrete items or areas of concern. For more information, see Anomaly Management. |
Note
Certain screens and tabs on the NEXUS IC interface may be hidden if the user lacks the necessary permissions for the underlying tables. For more information, see Permission Requirements for User Interface Elements.
 Dynamic Screens
Dynamic screens are opened when the user selects certain options from the Configuration or Database menus.
Unlike the static screens that are always available in the sidebar, dynamic screens are opened only when required. Once opened, they appear in the sidebar and can be accessed in the same way as other screens. Users can close dynamic screens at any time when they are no longer needed.
Examples of dynamic screens include database administration, user management and configuration-related screens.
 Toolbar
The toolbar provides quick access to commonly used actions for the currently active screen.
The available toolbar buttons vary depending on the screen. For detailed information about the toolbar options, see the screen descriptions.
 Asset Tree
The asset tree appears on the ASSETS, PLANNING and INSPECTION screens and may also be available in various dialogs throughout the application.
The asset tree provides a hierarchical view of assets and allows users to navigate efficiently through asset structures. Traffic lights can be enabled to display preconfigured traffic lighting values for asset nodes within the tree. For more information, see Asset Tree.
 Screen-Specific Content
This area displays the primary content of the currently selected screen.
Depending on the active screen, information may be presented in data grids, forms, dashboards, charts or other screen-specific views. Many screens also include tabs and toolbars that provide access to additional information and actions related to the selected records.
For information about working with data grids, including sorting, filtering, grouping and managing data, see Using the Grid.
 Status Bar
The status bar, located at the bottom of the NEXUS IC interface, displays key system and session information including the connected database server and name, number of users and active jobs, connection latency, memory usage, software version, and database schema number. For more information, see Using the Status Bar.