Configure Chart Templates
Under , you can create, edit and delete chart templates and manage the series assigned to them.
Chart templates can be displayed in the following locations:
The Charts tab of the ASSETS and INSPECTION screens (see Charts (Assets) and Charts (Inspection))
Report templates (see Report Templates)
Dashboard reports displayed on the Dashboard tab of the ASSET screen and on the DASHBOARDS screen
Charts are displayed on the Charts tab only when they are relevant to the selected data. For example, inspection data charts are available on the INSPECTION screen, while asset-based charts are available only when the relevant asset is selected on the ASSETS screen.
Manage Chart Templates
You manage chart templates on the Chart Templates screen (), which is divided into two main sections:
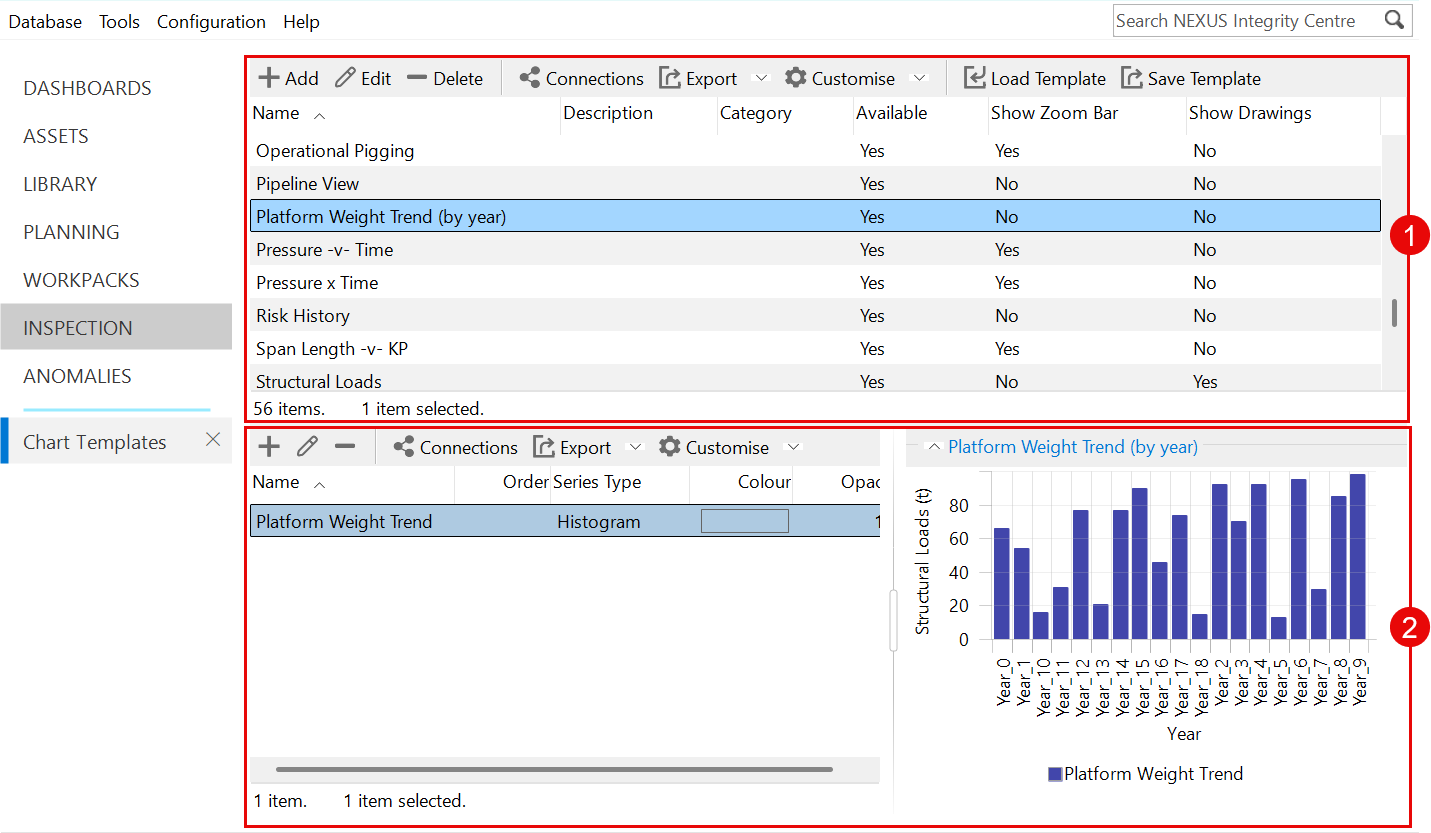
 Chart Template Configuration:
You use the standard grid toolbar (see Using the Grid) in the upper section of the screen to manage chart templates (see Create Chart Templates).
You can also save a chart template and load a previously saved template (see Load and Save Chart Templates).
 Configuration of Series:
You use the standard grid toolbar (see Using the Grid) in the lower section of the screen to manage series within the selected chart template (see Manage Series for Chart Templates).
Create Chart Templates
To create a new chart template, proceed as follows:
Click Add at the top of the Chart Templates screen.
On the Chart Template tab, enter a name and configure the required properties (see Add/Edit Chart Template Dialog).
Assign at least one series to a chart template. For more information, see Manage Series for Chart Templates.
Configure one or more axes for each series. For more information, see Configure Axes for a Chart Template Series.
If required, you can also set up a drawing or image as the background of the chart. For more information, see Charts and Drawings.
To edit an existing chart template, select it and click Edit, or double-click the template.
Manage Series for Chart Templates
You can manage a chart template’s series in one of the following ways:
Edit the chart template and open the Series tab
Use the lower section of the Chart Templates screen
A preview pane is displayed in the lower right corner of the screen. As you add or modify series, the preview displays randomly generated sample data to illustrate how the chart will appear.
If the chart includes a legend, the legend is interactive:
Hover over a legend item to highlight the corresponding chart element
Click a legend item to show or hide the corresponding chart element
When creating or editing a series, enter a name and configure the required properties (see Add/Edit Series Dialog).
Configuring Axes
Each series must have one or more axes configured. For more information, see Configure Axes for a Chart Template Series.
Load and Save Chart Templates
Click Save Template on the toolbar to export the selected chart template and its related configuration to a .chart file.
When saving a template, NEXUS IC identifies all dependent items associated with the chart template, such as asset information forms, event definitions, chart templates and lookup tables. A dependency selection dialog is displayed, allowing you to choose which related items to include in the exported file.
To import a previously saved template, click Load Template. This allows you to load the chart template to this or another database.
If the chart template already exists in the database, the imported version overwrites the existing template and does not create a copy of it. The same behaviour applies to any related items included in the .chart file, such as asset information fields and lookup tables.
Predelivered Chart Templates
NEXUS IC includes the preconfigured Pipeline View chart template.
Pipeline View provides a three-dimensional representation of a pipeline and uses the Y axis to represent pipeline diameter. If no Y axis value is configured, the pipeline cannot be displayed.
Because the Y axis is used for diameter, the Z and Z2 axes are used to represent distance along the pipeline. Similar to the X and X2 axes, these two axis types define the start and end positions of an item displayed on the chart.
For information about all configuration requirements for Pipeline View, see Configure Pipeline View Chart.
See also