Sources
Simple Source
You can edit the Simple Source by double-clicking it. You can choose a table for this Simple Source. The table you choose will obviously depend on the data you want to show: if you want to display GVI event data, you would choose your GVI event table. If you want to display data about events overall, you would choose the Event table. And so on.
Fields
The second tab on the Simple Source dialog is Fields. This shows you all the fields in the source you’ve selected, plus any extra columns you may have added. The Show Local Columns button controls whether fields in this source are selected.
Filters
The third tab is Filters. Here you can control which rows are returned from the table. If Parameter is set to None, you will be able to immediately choose a value.
If this is a string or a numeric or a whole number field, you can simply type a value in.
Some fields are keys to other tables. For example, in the Event table, Asset, Event Type, Survey Set, and Workpack are keys to other tables.
If your filter field is a key to another table, you will be given a  button to allow you to pick a value. For example, if your source table is Event, and your filter is on Workpack, clicking the button will bring up a list of workpacks to pick from. If your Comparison is ‘=’ (equals), you can pick just one item; if your comparison is ‘in’, you can pick several items by checking the checkboxes next to each desired item.
If the field you want to filter on is in this table, click the  arrow to choose it from the list. If it’s not, you can click the button to pick the field you want from any table. NEXUS IC will figure out a path connecting the Table you selected to the field you have selected. If there is only one such path, NEXUS IC will choose correctly; if there are multiple paths, you may experience unintended behaviour.
‘like’ is only applicable to string comparisons: use ‘%’ (percent) to match several unknown characters, and ‘_’ (underscore) to match a single unknown character. For example, Name like _VI would match ‘GVI’ and ‘CVI’; Name like ‘PL %’ would match ‘PL Anode’, ‘PL Damage’, etc.
‘<’, ‘>’, ‘<=’ and ‘>=’ are only meaningful for numeric and whole number types — their behaviour on key fields are undefined.
If you would like to test whether a key is null, just use ‘=’ as the comparison, and leave the value blank.
If Parameter is set to User, then when the user runs the report, they will be asked for a choice. The equals/in rule described above still applies: if you choose ‘=’ for your Comparison, the user will be able to choose one item; if you choose ‘in’, the user will be able to choose several items.
Asset selection is a special case: here, the correct field to choose is ‘Asset Location.VN_ID’, and ‘Is Child Of’ is added to the Comparison list. An illustration of how to configure a filter to let the user choose a single asset, and have the query report on that asset and its children is shown here:
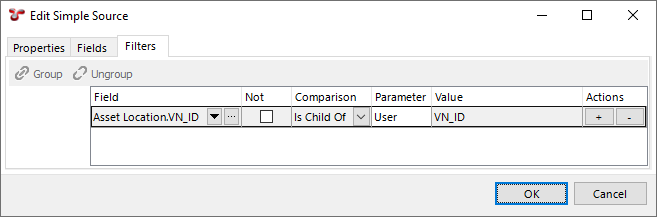
If you wanted to report on just that asset, you would use ‘=’ as the Comparison, instead of ‘Is Child Of’. If you wanted to let the user select several assets, you would use ‘in’ as the Comparison.
Other special cases exist for reports run from the Reports menu button on each screen in NEXUS IC:
| Screen | Parameter |
|---|---|
| Assets | View_Node |
| Library | Library |
| Planning | View_Node |
| Workpacks | Workpack |
| Inspection | Header / Finding (depending on what is visible) |
| Anomaly | Anomaly |
If you use one of these special parameters, then when a user runs your report template from the appropriate screen, the currently selected item will be pre-populated into the parameter in the report generation wizard. For example, if you set up a report template with an Anomaly parameter, then when the user runs your template from the Anomaly screen, the currently selected Anomaly will be automatically selected in the report wizard.
The Parameter choice of ‘Group’ only has meaning if this Simple Source is inside an Element Group (available from the Available Elements list at the left of the Report Template dialog). If you choose ‘Group’, then this filter will pick its value from the Simple Source used for the Element Group.
Filters can be connected by “All” or “Any” connectors. If you have multiple filters, you’ll see a drop-down appear at the left. If you select All, then all these filter criteria must be met for data to be returned. If you select Any, then if any criterion is met, data will be returned. (All and Any are equivalent to SQL’s AND and OR.) You can construct more complex combinations by grouping rows: use the Shift and/or Ctrl keys on the keyboard and click filters to multi-select. Then click Group. The rows you selected will be joined together into a group with their own Any/All filter, and that group will be connected to other groups with a separate Any/All connector. By choosing your grouping and choosing Any/All as appropriate, you can construct any logical expression you desire. You can ungroup rows by selecting a row within a group and clicking Ungroup.
Union Source
A Union Source lets you join together results from several other Sources, much like SQL’s UNION ALL. In the Union Source, select the sources you’d like to pull data from. Only columns that are common to all selected sources will be passed through to any element that consumes the Union Source. So if you chose two tables, both of which had a Name column, your Union Source would have a Name column.
When configuring a Union Source, ensure that every source being unioned is named differently, otherwise when saving and loading a report template, the sources within the Union Source will not all be retained.
Distinct Source
Sometimes, you want just a subset of a table’s rows, showing each value (or combination of values) just once. (A common reason for this is as the source for an Element Group.) Suppose you wanted a list of Task Categories that were actually in use. (This might be different from the full list from the Task Category table.) Create a Simple Source and set its Table to Task. Then create a Distinct Source, set its Source to your simple source, and then select the Category column. Now this Distinct Source is a data source that you can use in an Element Group (or anywhere else) that will have one row for each value of Category found in the Task table.
(Another way of grouping rows is by using a Pivot Table.)
Parameter Source
If you want to use parameters chosen by the user in headings, text, etc., add a Parameter Source. (You don’t need one of these to use parameters in simple source filters.)
Note
A source without a parent source or table will be displayed with a question mark indicator over its icon. This is an easy way to identify sources that have not been set up or are no longer in use.