DASHBOARDS
The Dashboards area displays the output from any report template which has been configured in the report template library and marked as a Dashboard. For the Dashboards Screen, choose report templates which summarise data in the database, or that show statistics on Anomalies or Risk.
When a user logs in NEXUS IC the first time, he/she will be presented with the Dashboards Page. On subsequent logins, NEXUS IC will open to screen that was active when the user logged out.
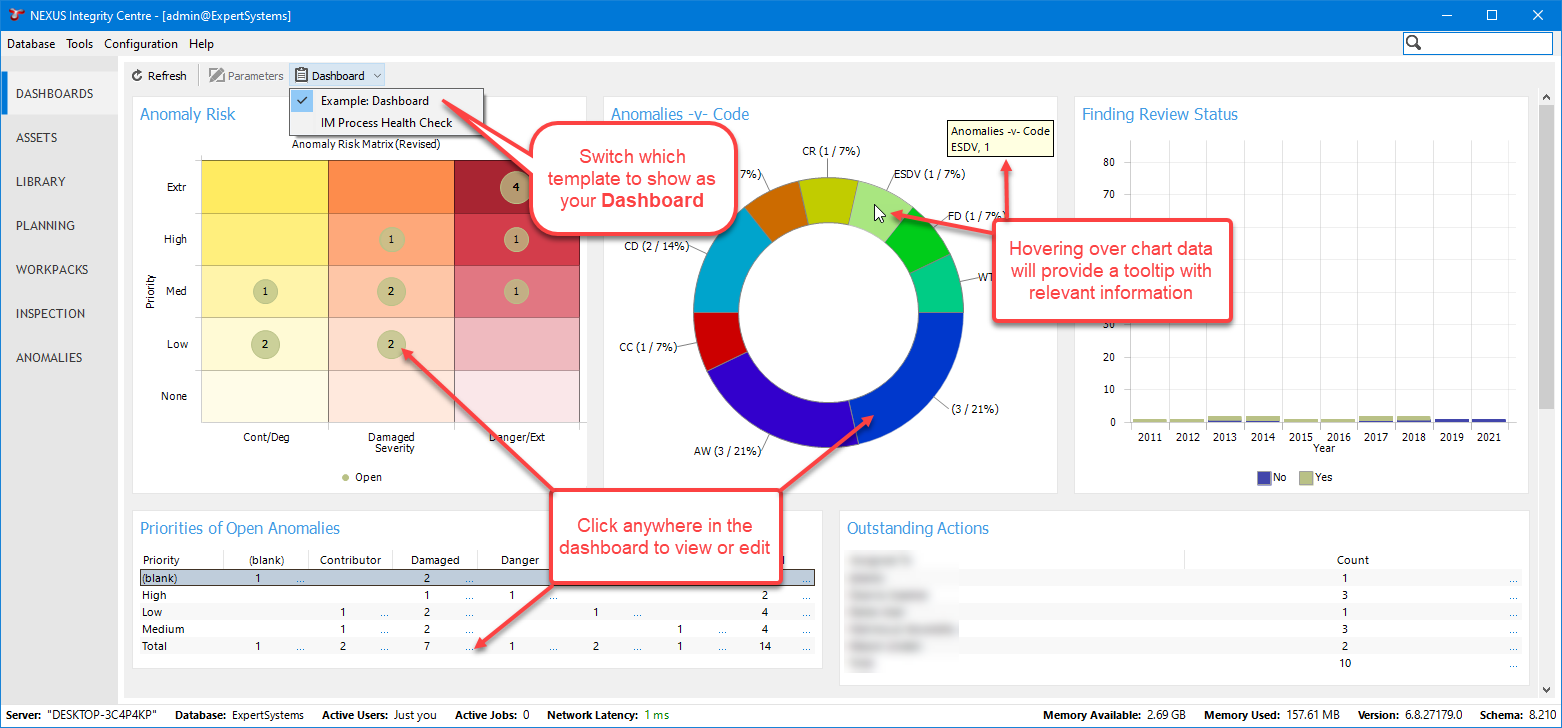
To choose which dashboard template is shown, click the Dashboard drop-down button on the toolbar, and choose the desired template.
Tables have a blue  ellipsis at the top right. You can view or edit the contents of a table row by clicking the row then clicking the blue ellipsis, or by double-clicking the row.
Pivot tables have a  ellipsis on each cell that contains a number. Clicking that ellipsis will show either a grid with a list of all the rows that make up the number in that cell, or a form showing the single row represented by that cell. If you have edit permission on the relevant table, you can make changes here and click OK to save them.
For charts (including risk charts) you can click on a data point, and you will similarly get a list of rows that make up that point, or a form showing the single row represented by that cell. Hovering over a chart element will show a tooltip with relevant information. This functionality is similar to that of charts in the Charts tab. Note that hover tooltips are not visible on Risk Matrix or Tables.
To choose which report templates are available as Dashboards, navigate to the Templates dialog. Edit the required report template and tick Dashboard Report. (You can use Multi-Edit to edit several templates at once.)
Refer to the section Report Templates for detailed information on configuring report templates.