Anomalies
Anomalies are records which identify discrete items or areas of concern. An anomaly record may have been originated from an inspection item (which means that it will have a finding linked to it) or it may be a stand alone record created outwith the integrity and inspection cycle (ad-hoc).
Anomalies can be accessed from the ANOMALIES screen, or from here in the Anomalies tab on the Assets screen. From here you will see only anomalies which pertain to the asset you have selected in the asset tree; or, if you click the Child Assets button, to this asset and all its descendants.
Anomalies can be bulk imported from MS Excel or manually created from the Add Anomaly dialog.
Properties of an Anomaly
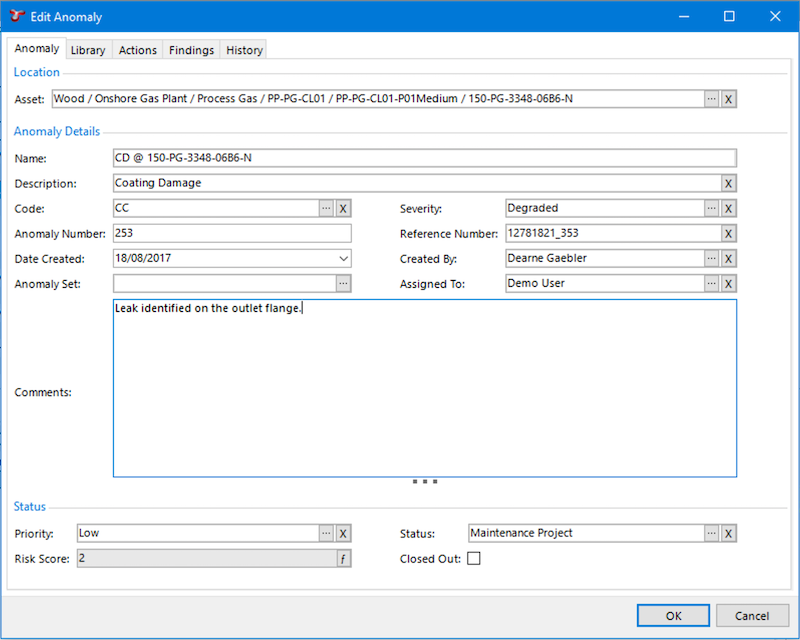
- Asset - The name of the asset that the anomaly is attached to. This is a required field.
- Name - A short (50 character limit) name for the Anomaly.
- Description - A 100 character field which provides more descriptive information of the anomaly.
- Code - Code which identifies the type of anomaly. Some typical codes may include “CD”, “PD” or “VIB” (Coating Damage, Physical Damage or Vibration) however, anomaly codes are user-definable and can be configured from Configuration ‣ Anomalies.
- Severity - Choose from a list of pre-defined Severity Levels. Typical severity levels may include “Level 1 - Contributor”, “Level 2 - Degraded”, “Level 3 - Damaged”, “Level 4 - Danger” and “Level 5 - Extreme Danger” however, severity levels are user-definable and can be configured from the Configuration ‣ Anomalies area. Anomaly severities can also be assigned to Anomaly Triggers and will be pre-populated from the initial automatically generated Finding, through to the anomaly that the finding is linked to.
- Priority - Choose from a list of pre-defined Priorities. Typical priority levels may include “Very High”, “High”, “Medium”, “Low” or “Very Low” however, the list of anomaly priorities are user-definable and can be configured from the Configuration ‣ Anomalies area.
- Anomaly Number - A numerical property which can be used to store a number against the anomaly. This number is not auto-populated.
- Anomaly Set - Is an alternative option for grouping anomalies. A common grouping may include “Topside” and “Subsea” however, Anomaly Sets are user-definable and can be configured from Configuration ‣ Anomalies.
- Reference Number - A 200 character limit field which can be used to reference (or cross reference) anomalies.
- Date Created - The date the anomaly was first created. This will default to todays date, but is editable thereafter.
- Created By - Name of the person creating the anomaly record. This will default to the currently logged in user, but is editable thereafter.
- Assigned To - Name of the person to which the anomaly record is assigned.
- Comments - A large free text field to retain additional information about the anomaly which may not be captured in the properties of the anomaly.
- Status - Status of the anomaly. Anomaly statuses are user-definable and can be configured from Configuration ‣ Anomalies.
- Closed Out - A check box which identifies whether of not the anomaly is Open or Closed. Closed anomalies are normally excluded from anomaly statistical reporting.
- Risk Score - This is a calculated field, the function assigned to this field is named “System - Anomaly - Risk Score” and must be configured through the Functions. Different fields such as the “Severity” and “Priority” of the anomaly can be used as the input parameters for the function.
Report Table Sources
To extract anomaly data into a report template, use the System Table titled Anomaly as the primary Table Source. For more information on Report Templates see Report Templates.
The Grid
The anomalies grid lists all anomalies based on the currently applied filters. Primary filtering options are:
- Workpack; and
- Asset.
Filters are set and cleared using the Filter menu on the Anomalies toolbar.
Tip
Use the grid Grouping functionality to group and filter anomaly records. It is a quick and easy way to drill down to the anomalies that you are particularly interested in reviewing.
The Anomalies Toolbar
- , , :
- Add / Edit / Delete anomaly(s).
Tip
To bulk update (or delete) anomalies, use the Multi-Edit functionality available from the anomalies grid.
- See Import for full description of the Import menu item.
- See Export for full description of the Export menu item.
- See Customise for full description of the Customise menu item.
- See Connections for information about the Connections toolbar option.
- Click this to close out the anomaly. You will be shown an Anomaly Action dialog. This dialog lets you create an anomaly action saying why the anomaly was closed out, and by whom.
- Clears any currently applied anomaly filters.
- Allows you to filter the anomaly listing by one or more workpacks. Workpacks are linked to anomalies via the linked findings and events.
- Allows you to filter the anomaly listing by a user-selected sub-set of assets. Assets are linked to anomalies by the Asset chosen in the Anomaly record itself AND by the linked findings and events.
- See Reports for information about the Reports toolbar option.
Matrix
You can show anomalies on a risk matrix. This (when configured) is visible at the right or bottom right of the screen.
Each anomaly’s Risk Score is used to place it on the diagram. Note that anomalies do not have a Likelihood or Consequence to give them an X/Y position on the diagram — they only have a Risk Score. So if your diagram has several squares with the same Risk Score (as is usually the case), your anomalies will be placed in the left-most such square. That is, risk-assessed assets are placed in a particular square, but anomalies are merely placed in a particular band.
The matrix legend is displayed below the chart, with coloured indicators for open and closed anomalies. Legend keys can be clicked to toggle showing their corresponding anomalies on the matrix.
To make this matrix work, you will need to configure . You will also need to configure the “System - Anomaly - Risk Score” function.