Grouping
When the Grouping panel is visible, column headings can be dragged onto it from the grid. It is also possible to group by multiple columns.
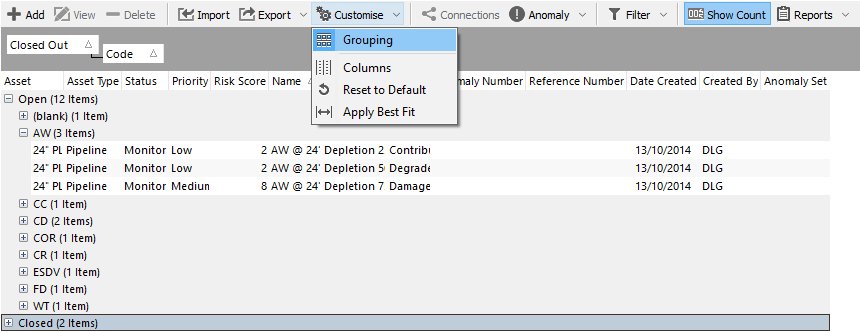
Click the Customise button on the toolbar above a grid. If Grouping is selected, you’ll see a dark grey bar at the top of the grid. This bar can contain one or more column headings. In the screenshot below, you can see the default grouping in the ANOMALIES screen. You can see that the grid appears as a “tree”, with [+] or [-] marks at the left of each category. The first level of the tree is the first thing shown in the grey Grouping bar — in this case, Closed Out. The second thing in the Grouping bar corresponds to the second level of the tree, and so on. You can click on “columns” in the grey Grouping header to sort by them or to filter by them. You can drag column headings off the grid and onto the Grouping bar, or back from the Grouping bar onto the headings row of the grid. You can drag items around in the Grouping bar to control which level is first in the tree.
Almost all grids in the software can be grouped in this way.
See also: Customise, Sorting, Filtering, Find As You Type.