Base Expert System
Overview
The Base Expert System is a foundation level configuration for all other Expert System databases to subscribe to.
This Expert system contains Chart and Report Templates configured from generic system tables (Anomalies, Findings, Events etc.) as well as several DB Admin reports providing information on user login activity and database configuration data.
Codes / Standards
N/A
Asset Types
N/A
Asset Information
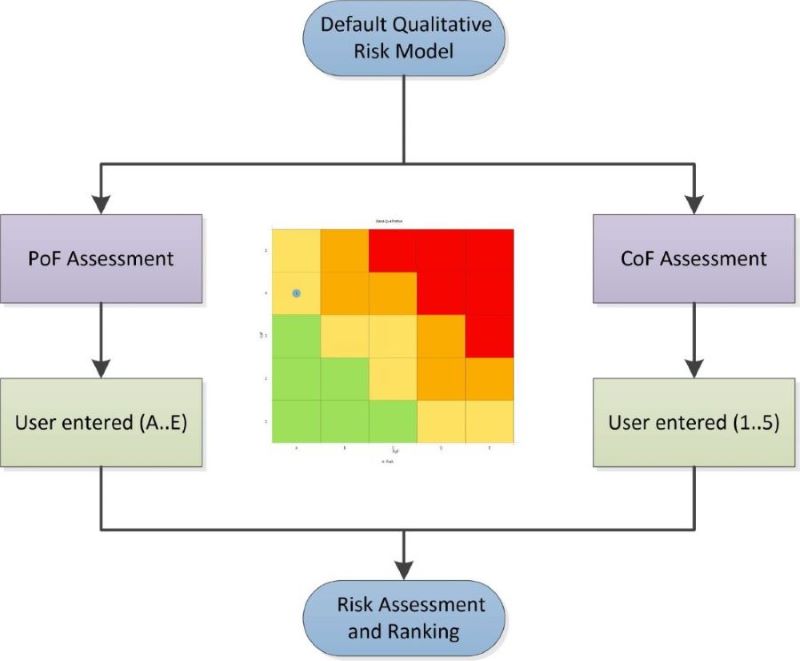
Qualitative Risk Assessment - Input parameters for the Default Qualitative Risk Model
Risk Models
Functions
There are some generic, commonly used functions in this database such as Date of most recent event (by Event Type) and several Date to String conversion functions.
The following generic functions have been configured in the Base Expert System:
| Function | Description |
|---|---|
| Date of most recent event (by Event Type) | Takes the Component_ID and Event Type name and returns the most recent event date (including child assets) |
| Date (MM-DD) as String | Returns a Date value as a string in MM-DD format |
| Date (YYYY) as String | Returns a Date value as a string in YYYY format |
| Date (YYYY-MM-DD) as String | Returns a Date value as a string in YYYY-MM-DD format |
| Normalise Axis Value | Takes the assessment value as a whole number and the number matrix granules on this axis, then returns a value between 0..1 to be plotted on the Matrix on this axis). |
| Pad Leading Zeroes | Takes the whole number value to pad and the max length of the whole number) |
| Today’s Date (as Date) | Returns today’s date in Date format |
| Today’s Date (as Date/Time) | Returns today’s date in Date/Time format |
| Yes/No to Colour | Takes Yes/No as an input value and returns NEXUS Green and NEXUS Orange from the NEXUS colour palette. |
Inspection / Maintenance Events
N/A
Traffic Lights
| Traffic Light Name | Description |
|---|---|
| Anomalies | |
| Event History | Highlights where events have been created on the asset tree. |
| Incomplete Tasks | Highlights where incomplete tasks are the active workpack on the asset tree. |
| Risk | Shows the risk for each asset. |
| Rolled up Risk | Shows the rolled up (maximum) risk for an asset and all of its children. |
Dashboards / Reports
System Table Report Elements - A report containing sample tables and charts from the base system that can be used to help accelerate construction of other reports. Use the “Retrieve Element” button to transfer selected items to your new report.
Daily User Login Profile - Charts and lists user logins between two user-defined date parameters.
Database Configuration - Tables which describe the database configuration