What’s New
Technical release information will be available in the release notes (this link not available until full release)
New features in NEXUS IC 6.3 include the following:
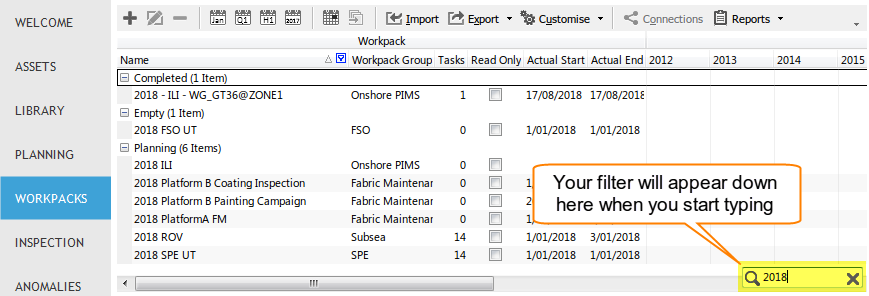
In-grid text filter
Finding the rows you’re looking for has never been easier — simply start typing in the grid when it has focus, and NEXUS will automatically filter the results based on what you’re typing. Only results that match what you’re looking for will be displayed. Made a mistake? Simply delete the filter, and your data comes back.
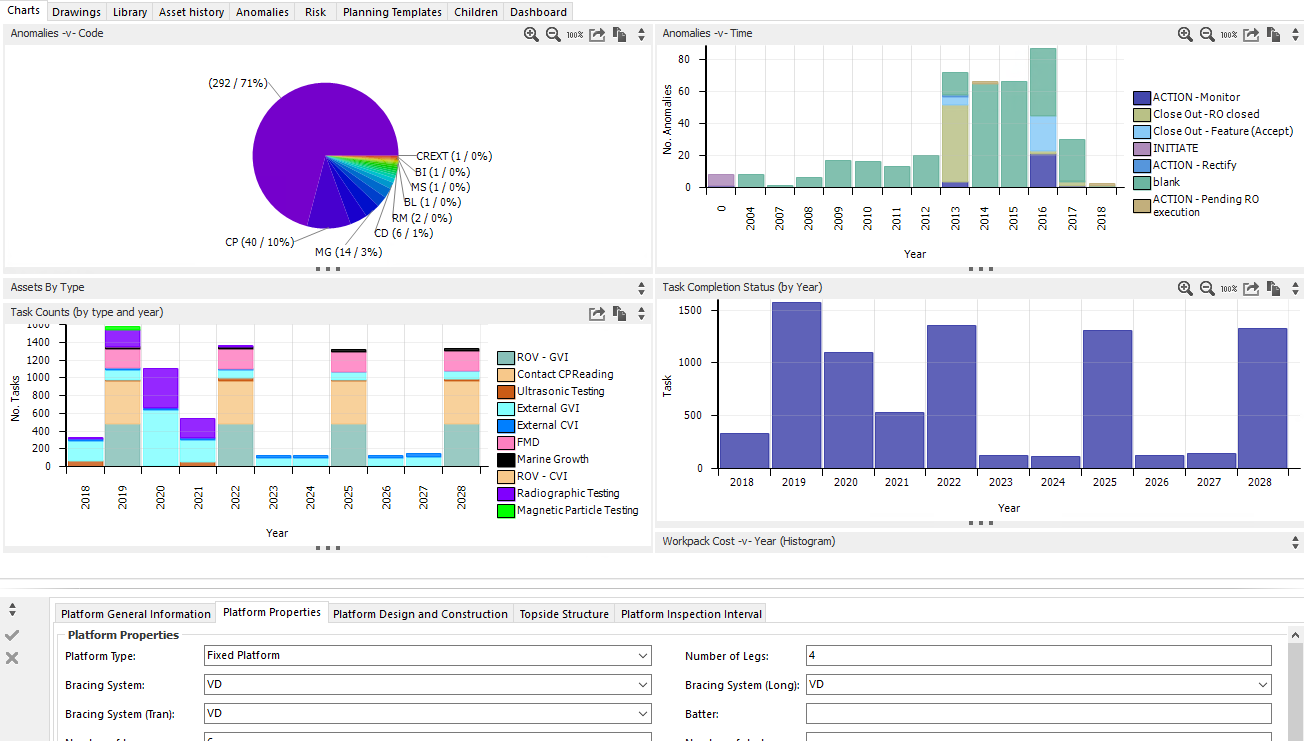
ASSETS Charts
The Charts functionality is now available from the ASSETS screen. This allows for charts to be displayed based on the currently selected asset (and child assets), with non-inspection data related charts all being automatically generated on-the-fly. Like the Charts functionality in INSPECTION, this is fully configurable and customisable.
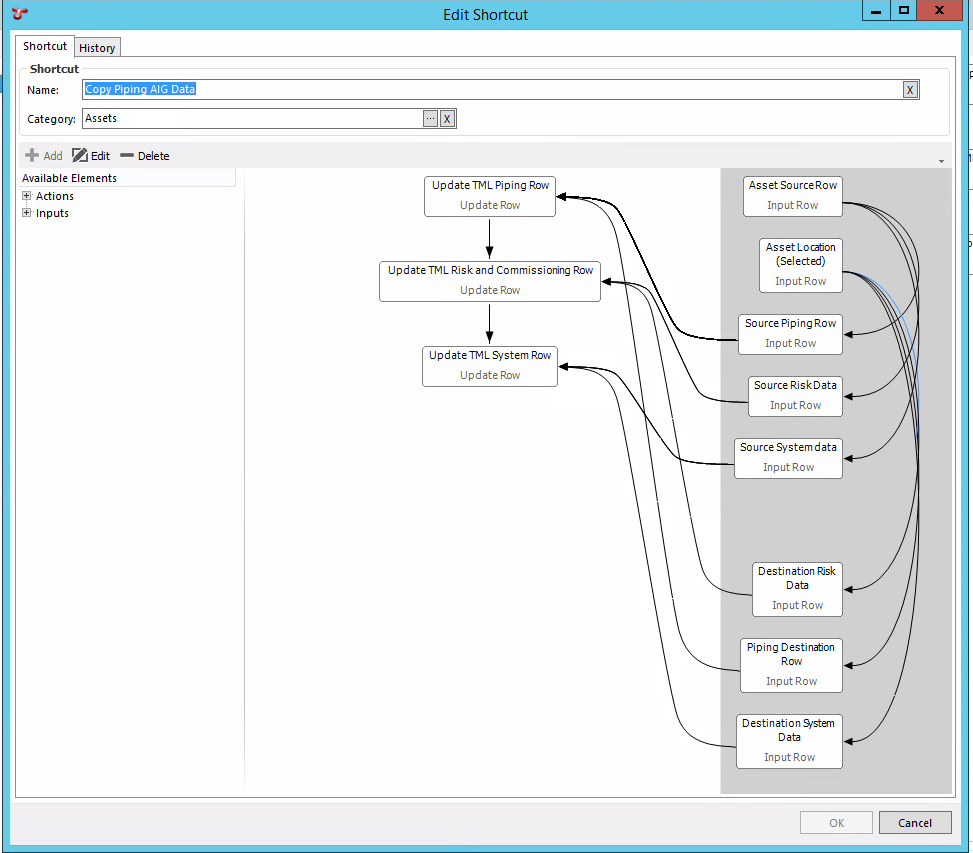
Shortcuts
A new advanced feature for power-users is the ability to define Shortcuts. This allows users to automate repetitive tasks at the click of a button. Want to bulk-update data to match a selected form? Or add new records to a Sub AIG? Or link an anomaly action to a Planning Template task, or send an email when data is changed or added? All of this is now possible, and is user-configurable by using Shortcuts. Trying to configure something tricky? Don’t lose productivity — get in touch with our support team and they’ll help you out.
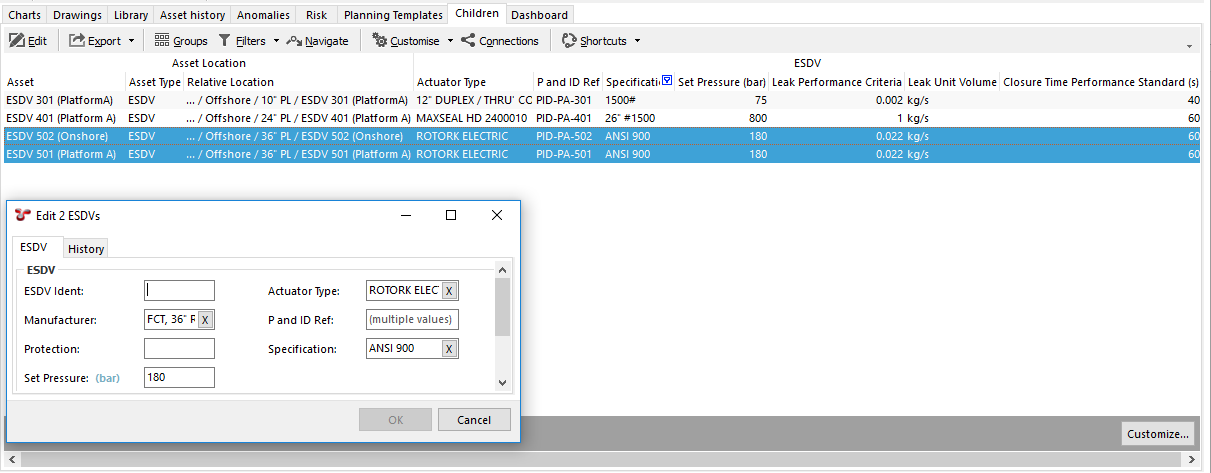
Edit data in the Children screen
You were always able to use the Children tab on the ASSETS screen to display asset data in a grid. We’ve enhanced this functionality so that you can use it to multi-select edit the AIG data too. No more Excel import sheet required — simply select the assets, click edit, and set the values. This works in fantastic synergy with the pre-existing ability to view immediate children or all children, as well as sort the displayed data in any way you wish. You can now find and update all relevant entries and update them in one hit.
Sensor Data
We have implemented the ability to monitor and view sensor data. You can see a miniature trendline of the last 30 days in the grid, as well as full trended data in the Charts screen in ASSETS.
Report Table Bands
You can now place report table columns into categories, which will show in your final report as “banding”.
Refreshing
There are some scenarios in which charts, risk matrices and/or calculated fields do not update when we expect them to. We are fixing these as and when we find them. We ask you, too, to report any refresh issues you come across.
Upgrading
If you’re upgrading from an older beta build of 6.3, you should run the installer on the application server or user’s PC. If you’re upgrading from 6.0, 6.1 or 6.2, you should similarly run the 6.3 installer.
Note
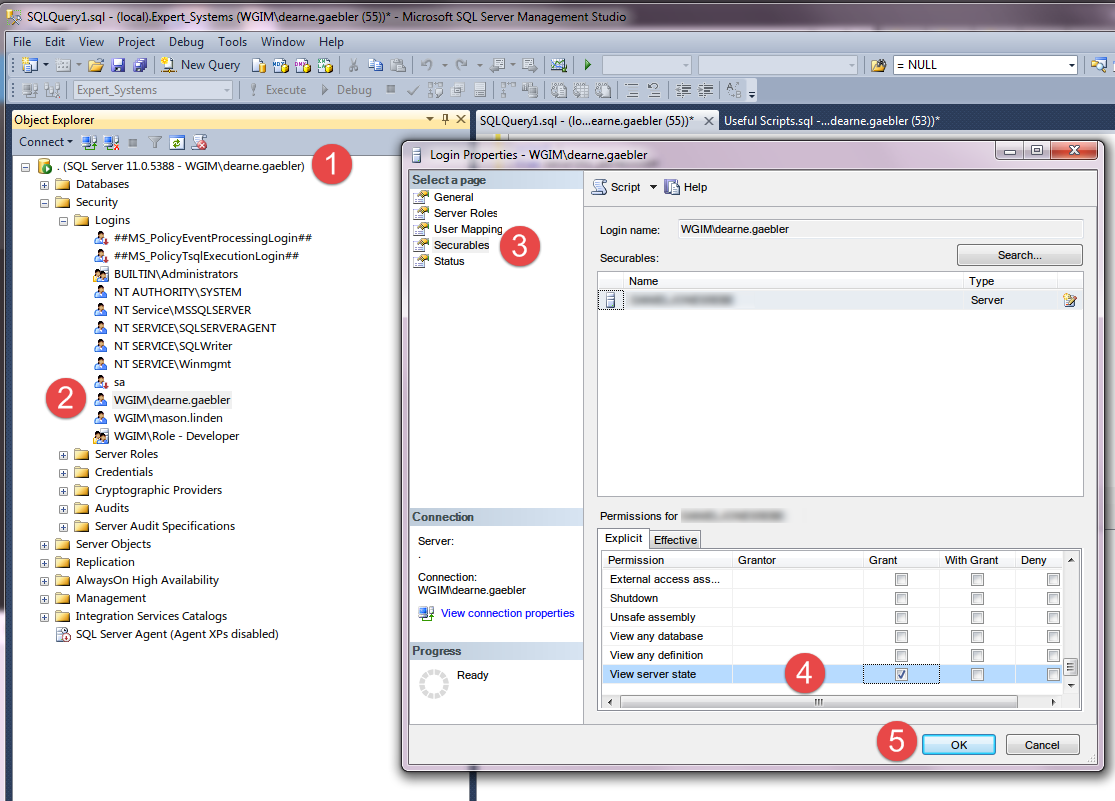
Important - Prior to updating to v6.3, your SQL Administrator will need to update permissions on the SQL Server for the NEXUS Login (or Login group). The Login (or Login Group) will require View server state permissions to be granted. This is a setting in the SQL Management Studio, available from Server Name | Security | Logins. Then choose Properties, Securables | Explicit | View Server State.
If you’re upgrading from 5.x, more effort is required.
