Sensors
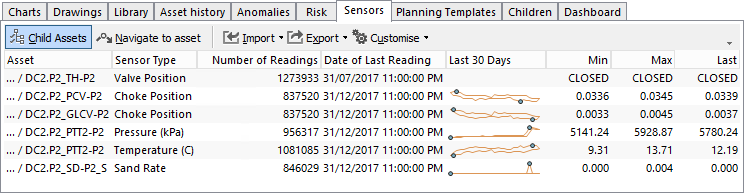
Sensor data is periodically logged (for example, once per hour). Here you can see a summary of sensor data, including a “sparkline” chart showing the last 30 days of data. The dots on each chart show the minimum and maximum (within the 30-day range). The two lines show the minimum and maximum values for that particular range – if the chart is 90 pixels wide, each pixel represents a third of a day, so a considerable range of values may occur within a single horizontal pixel.
Sensors Toolbar
- This menu item will display all children of the currently selected asset (multiple levels of the hierarchy) if it is selected. Note that if the selected asset has many children that are sensors with large quantities of data, this may be slow.
- This menu item will change the active asset in the Asset hierarchy to the currently selected asset in the data grid. By navigating to a different asset in the hierarchy, this will also update the contents of data grid.
- This is shared functionality refer to Import for a full feature description.
- This is shared functionality refer to Export for a full feature description.
- See Customise for information about the Customise toolbar option.